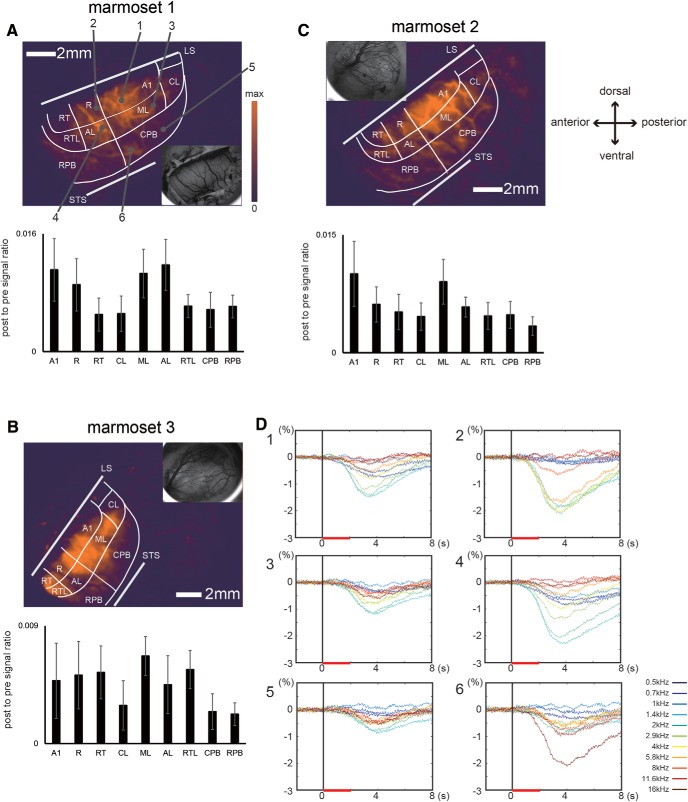
Figure 3.
Response magnitude maps and the mean response magnitude in each auditory area for the three marmosets. A–C, top, Response magnitude maps reconstructed based on maximum evoked optical signals for sound frequencies of 0.5, 0.7, 1, 1.4, 2, 2.9, 4, 5.8, 8, 11.6, and 16 kHz for each marmoset. The color indicates the maximum signal magnitude at each pixel according to scale bar shown in A. Blood vessel images for each map are shown in the inset. Bottom, The mean response magnitude and SD in each auditory area. LS and STS represent the lateral sulcus and superior temporal sulcus, respectively. D, Time course of optical signals in response to each stimulus frequency in the six regions indicated in A. The colors of the lines correspond to the optical signal evoked for each frequency. The vertical black lines and horizontal red lines represent stimulus onset and the stimulus presentation period, respectively.

