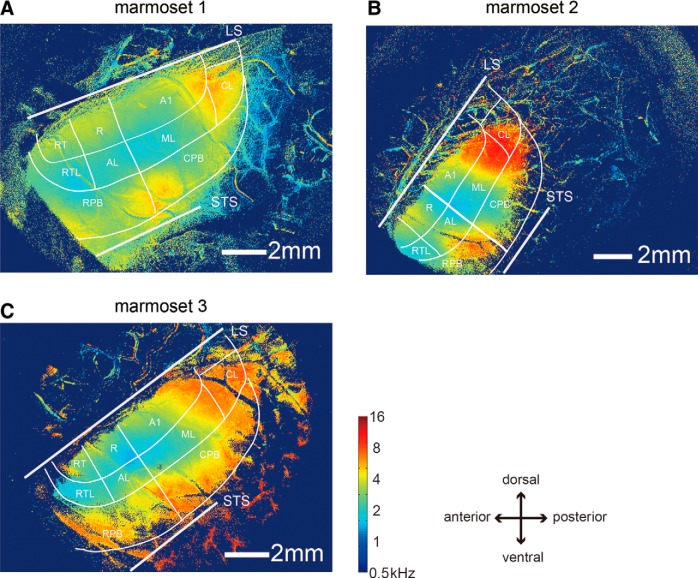
Figure 4.
Sound frequency preference maps for the three marmosets. A–C, Sound frequency preference maps reconstructed from averaged responses for all sound frequencies for the three marmosets. The color indicates the preferred frequency at each pixel according to the color code. LS and STS represent the lateral sulcus and superior temporal sulcus, respectively.

