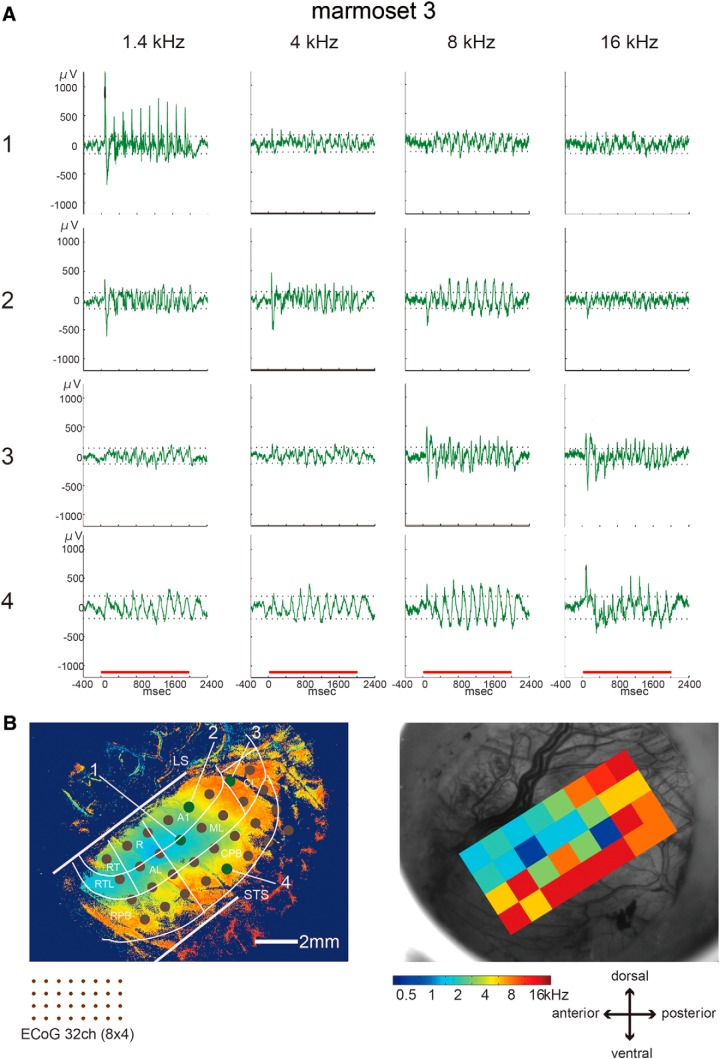
Figure 6.
Electrical responses to band-pass noise stimuli. A, ECoG responses to sound frequencies of 1.4, 4, 8, and 16 kHz at four contacts. The horizontal red lines represent the stimulus presentation period. B, left, Electrode positions of the ECoG device on the sound frequency preference map made based on OISI in Figure 4C. Green circles represent the contact positions shown in A. The brown circles correspond to the remaining contacts. LS and STS represent the lateral sulcus and superior temporal sulcus, respectively. Right, Sound frequency preference map reconstructed based on the maximum ECoG responses to all sound frequencies. Color indicates the preferred sound frequency at each contact according to the color code.

