
Figure 7.
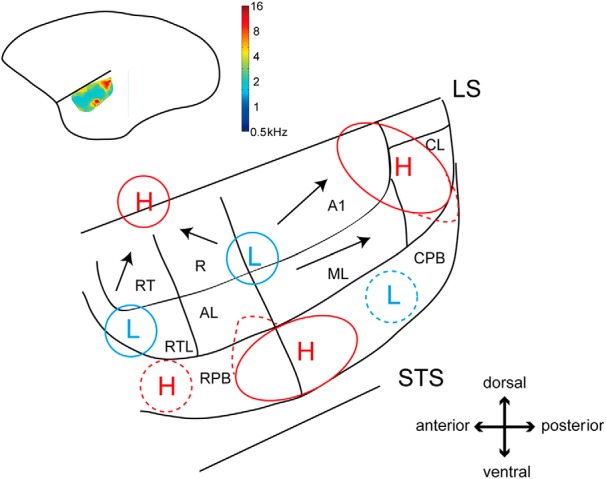
Sound frequency preference map for common marmosets. The circles surrounding H and L indicate regions with preference for high and low frequencies, respectively. The arrows indicate the direction of frequency preference change from low to high. The dotted region represents regions requiring further study. LS and STS represent the lateral sulcus and superior temporal sulcus, respectively. The color map in the simplified schematic of the marmoset cortex in the inset represents the sound frequency preference map.