Fig. 3.

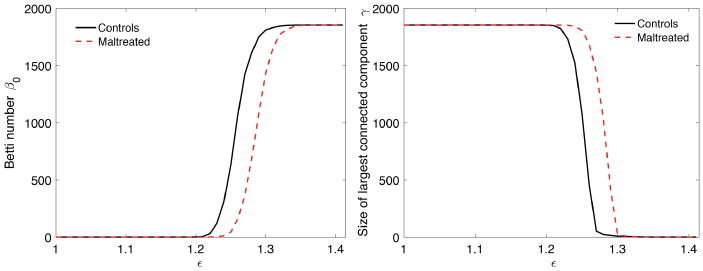
The plots of β0 (left) and γ (right) over showing structural network differences between maltreated children (dotted red) and normal controls (solid black) on 1856 nodes. (Color figure online)

The plots of β0 (left) and γ (right) over showing structural network differences between maltreated children (dotted red) and normal controls (solid black) on 1856 nodes. (Color figure online)