Figure 7.
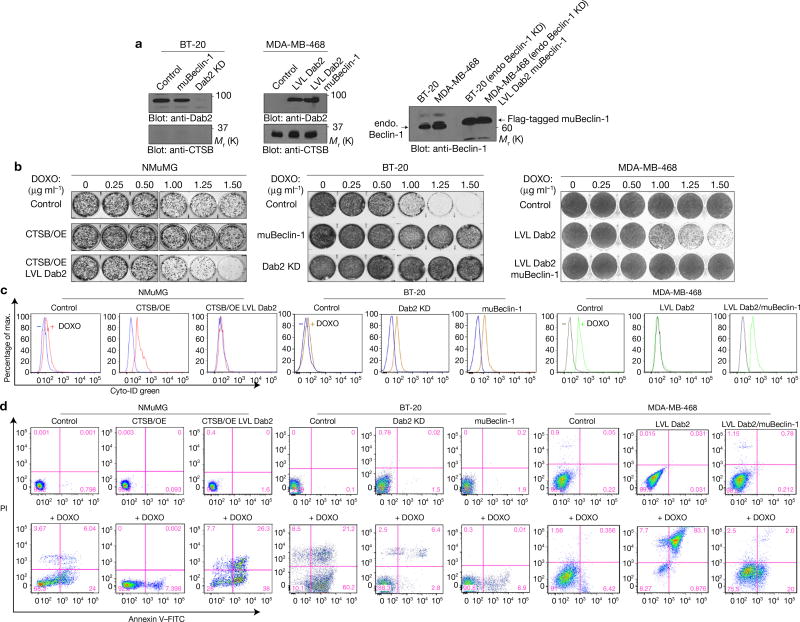
Dab2 promotes chemotherapy-drug-induced cell death by attenuating drug-induced autophagy. (a) Immunoblot analysis of whole-cell lysates prepared from BT-20 and MDA-MB-468 cells, and their modified derivatives, depicting the expression levels of Dab2, CTSB, endogenous Beclin-1 and Flag-tagged muBeclin-1. (b) Clonogenic assays depicting the dose-dependent effects of DOXO on cell growth in NMuMG, BT-20 and MDA-MB-468 cells, and their modified derivatives. (c) Flow cytometric analysis of autophagic flux in NMuMG, BT-20 and MDA-MB-468 cells, and their modified derivatives, incubated in the absence (left peak) or presence (right peak) of DOXO (2.0 µg ml−1) for 24 h. FITC-conjugated Cyto-ID was employed to measure autophagic vacuoles with representative histograms. (d) Flow cytometric analysis of apoptosis using Annexin V staining evaluated in NMuMG, BT-20 and MDA-MB-468 cells, and their modified derivatives, incubated in the absence (top panels) or presence (bottom panels) of DOXO (2.0 µg ml−1). The flow cytometry profile represents Annexin V–FITC staining on the x axis and PI on the y axis. The pink numbers represent the percentages of non-apoptotic cells (lower left quadrant), early apoptotic cells (lower right quadrant), later apoptotic cells (upper right quadrant) and dead cells (upper left quadrant). All experiments were repeated at least three times and similar results were observed. Unprocessed original scans of blots are available in Supplementary Fig. 9.

