Figure 5.

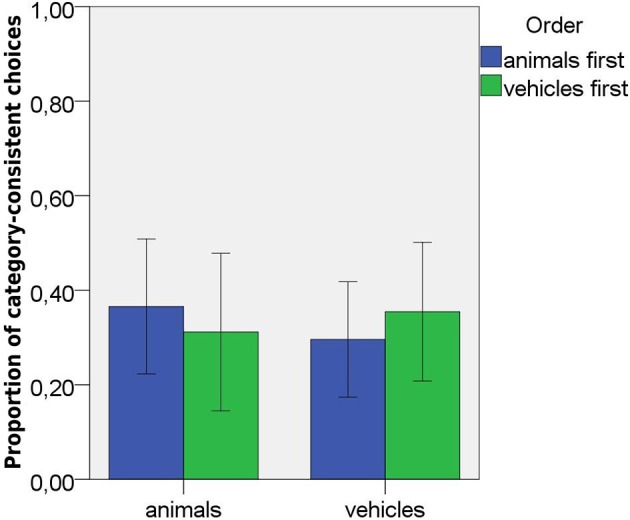
Proportions of category-consistent choices in Study 2 similarity task as a function of domain and order of presentation. Error bars represent 95% confidence intervals.

Proportions of category-consistent choices in Study 2 similarity task as a function of domain and order of presentation. Error bars represent 95% confidence intervals.