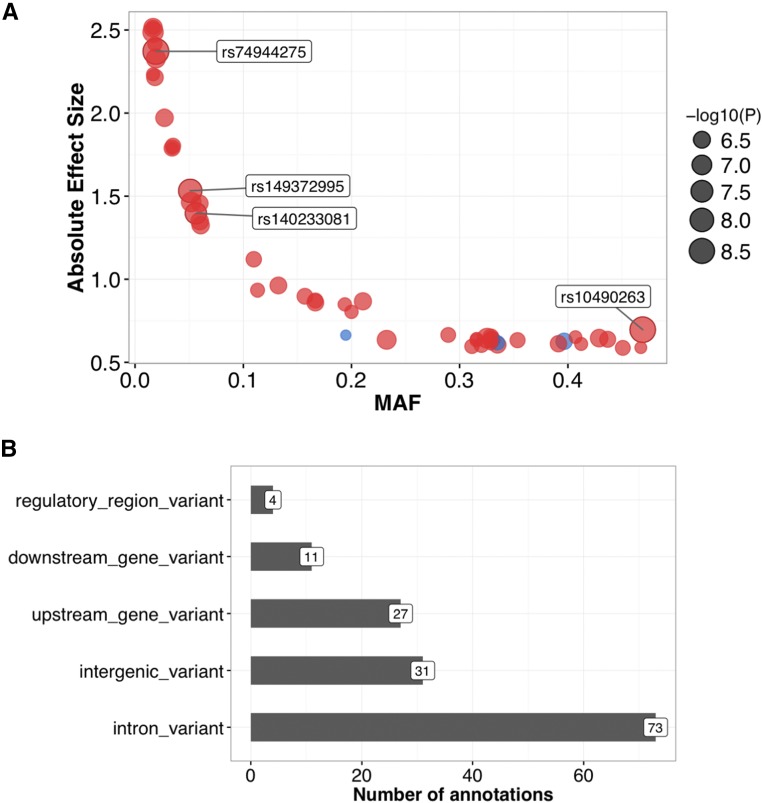
Figure 5.
Effect sizes and consequences of top variants. (A) Allele frequencies and effect sizes for all variants with Bayes-GLMM-derived P < 1 × 10⁻⁶. Positive-effect (i.e., risk-increasing) loci are in red and negative-effect loci (i.e., protective) are in blue. (B) Functional consequences of the top variants. MAF, minor allele frequency.

