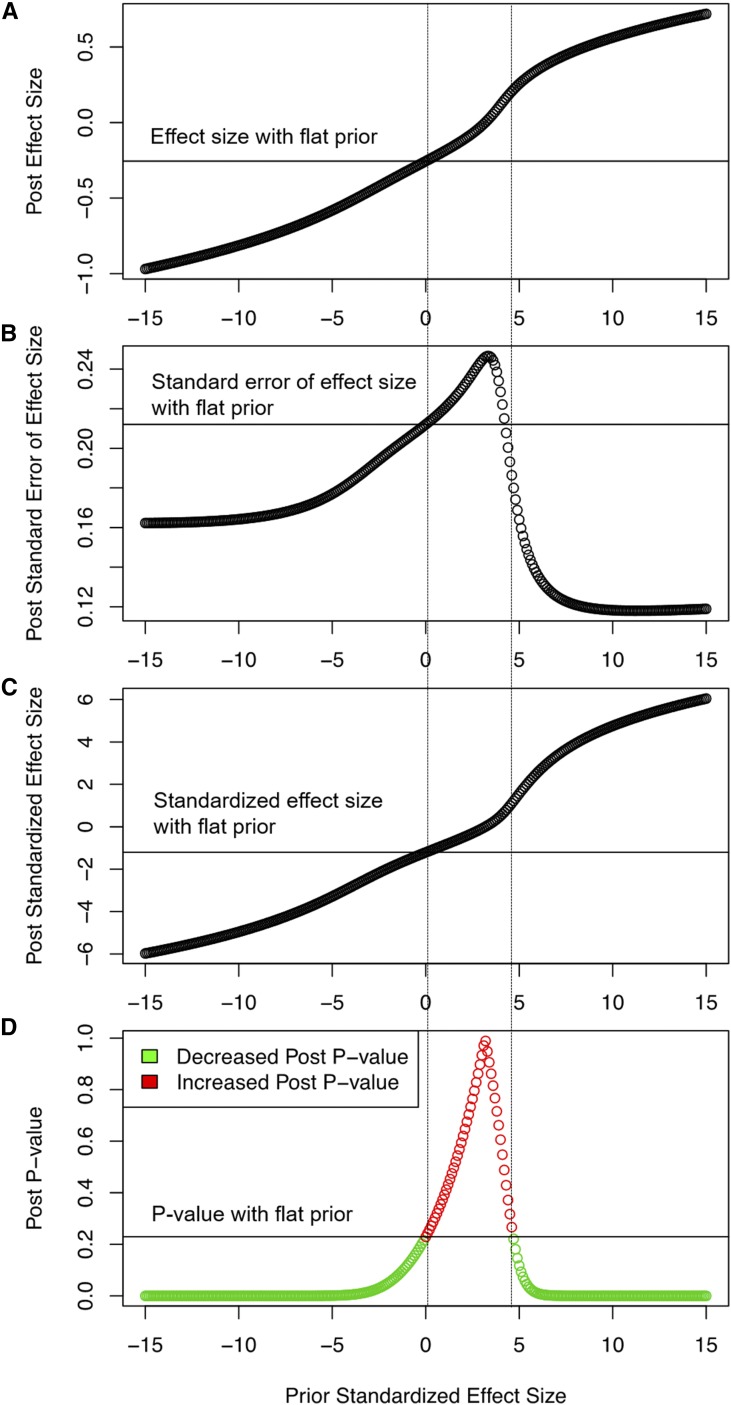
Figure 7.
Effects of priors on (A) posterior effect size, (B) posterior standardized error of the effect size, (C) posterior standardized effect size, and (D) posterior P-values. The x-axis denotes prior standardized effect size. The gray horizontal line in each graph is the respective posterior estimation when the prior standardized effect size is equal to 0. The two vertical dashed lines define a range of prior standardized effect sizes that increased the posterior P-value compared to a flat prior. Post, posterior.

