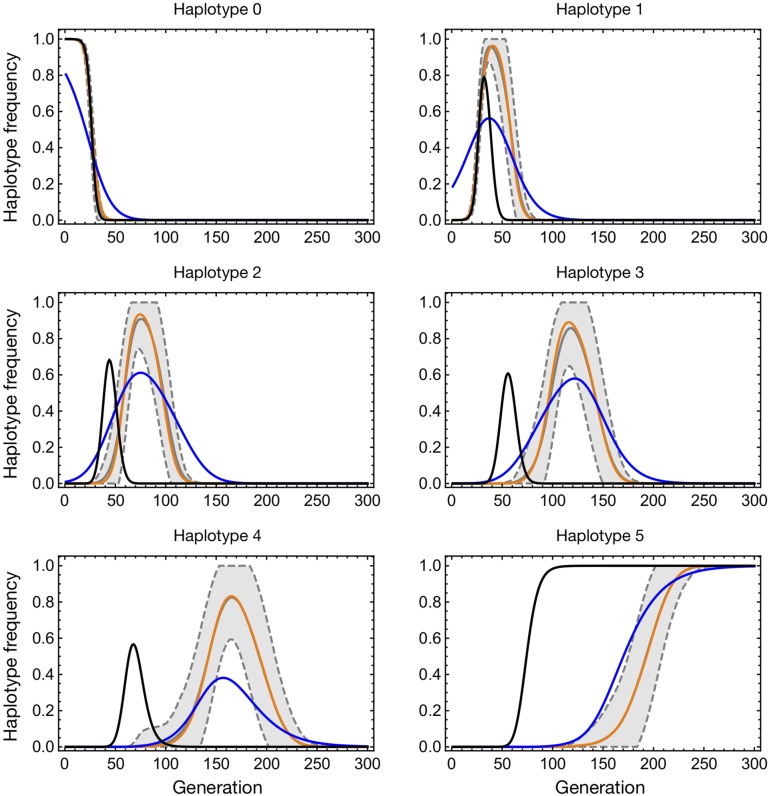
Figure 3.
Time-dependent dispersion of trajectories for the case , and Frequencies of each haplotype are shown reading left to right from the top. In each case, the solid gray line (sometimes obscured) shows the mean haplotype frequency of the simulated data across time, calculated across 100 simulations. The region within 1 SD of this frequency is indicated by gray dashed lines and is shaded. The black line shows the propagation of the deterministic model in the case where and the population starts at the same haplotype distribution as the simulation, while the blue line shows the results of a maximum likelihood fit between the deterministic model and the mean data. The mean maximum likelihood fit of the delay-deterministic model to the data are shown as an orange line.

