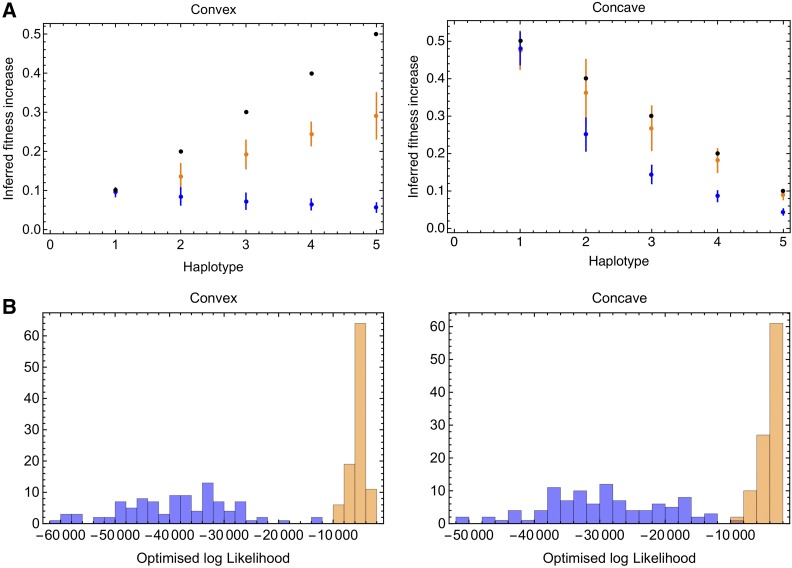
Figure 5.
Inferences from convex and concave fitness landscapes. (A) Fitness differences between haplotypes are shown as black dots. Mean and SD of inferred fitness differences were calculated for 100 replicates in each case, and are shown for the deterministic (blue) and delay-deterministic (orange) methods. (B) Optimized log likelihoods, describing the fit between the model and the data obtained for the deterministic (blue) and delay-deterministic (orange) methods.

