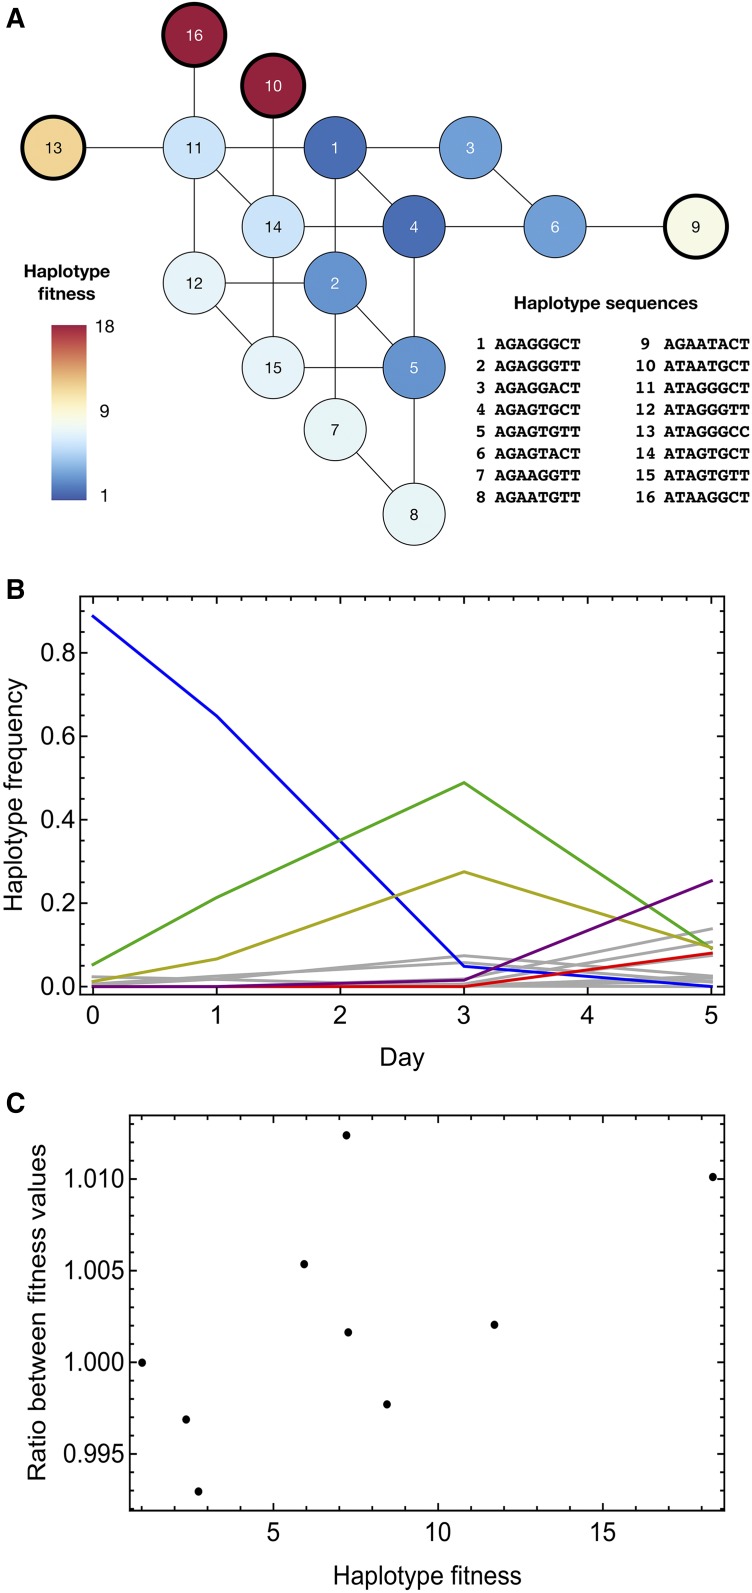
Figure 6.
(A) Fitness landscape inferred from experimental data using the deterministic method. Inferred fitnesses are given for haplotypes for which the inferred frequency reached ≥ 1% within the course of within-host evolution. Given haplotypes describe the sequence of the hemagglutinin segment of the virus at genome positions 339, 496, 728, 738, 788, 1018, 1020, and 1144. The haplotypes 9, 10, 13, and 15, marked in darker outline, were inferred to have zero initial frequencies. (B) Inferred changes in haplotype frequency over time. Haplotype frequencies are shown in gray, with the exceptions of haplotypes 1 (blue), 2 (green), 6 (yellow), 12 (purple), and 16 (red). (C) Differences in inferred haplotype fitness values between the deterministic and delay-deterministic methods shown proportional to the value inferred under the deterministic model.

