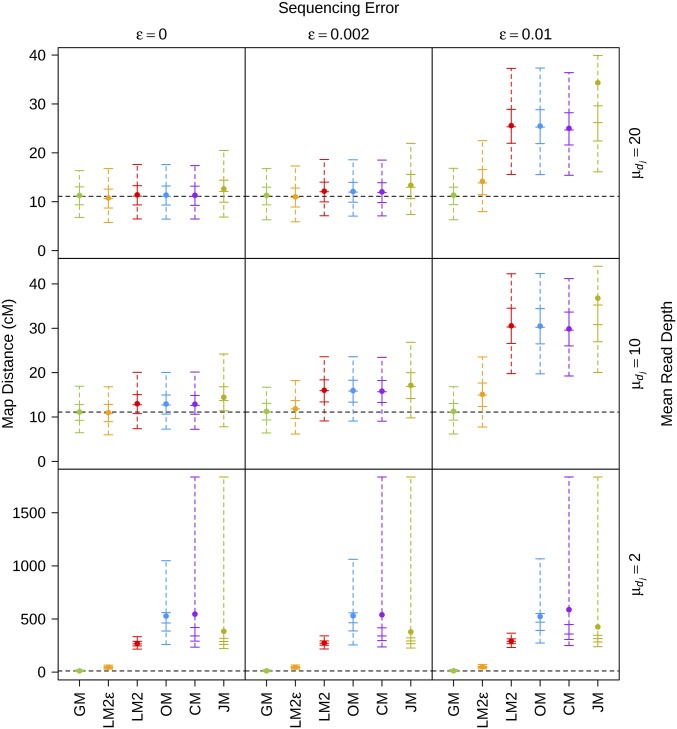
Figure 1.
Distribution of the map distance estimates for the first set of simulations across varying mean read depths (rows) and varying sequencing error rates (columns). The solid point represents the mean; the vertical solid line represents the interquartile range; the vertical dashed line represents the range between the 2.5th and 97.5th percentiles; the five horizontal solid lines represent, in ascending order, the 2.5th percentile, lower quantile, median, upper quantile, and 97.5th percentile; and the horizontal black dotted line represents the true parameter value. Map distances are in centimorgans and were computed using the Haldane mapping function.

