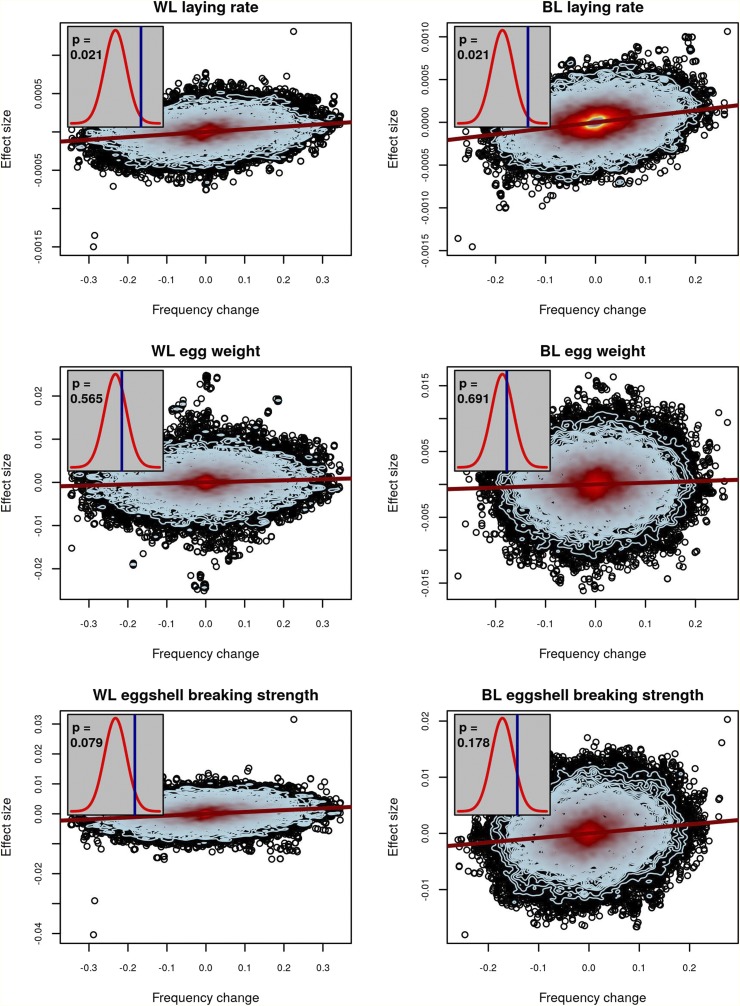
Figure 3.
Evidence of selection for chicken traits. For three traits in WL (left column) and BL (right column) hens, the relationship between estimated allelic effects at individual SNPs and the change in allele frequency over generations is plotted. The red line is a regression of effect size on allele-frequency change. Contour lines indicate the density of points, with blue contours indicating fewer points than red. Inset plots depict observed values of (blue lines) and their statistical significance based on a comparison to permuted null distributions (red densities) for no-selection scenarios. An exact two-sided P-value is given within each inset. Significant values of above the permuted mean indicate selection operated in the positive direction, while significant values below the permutation mean indicated selection operated in the negative direction.

