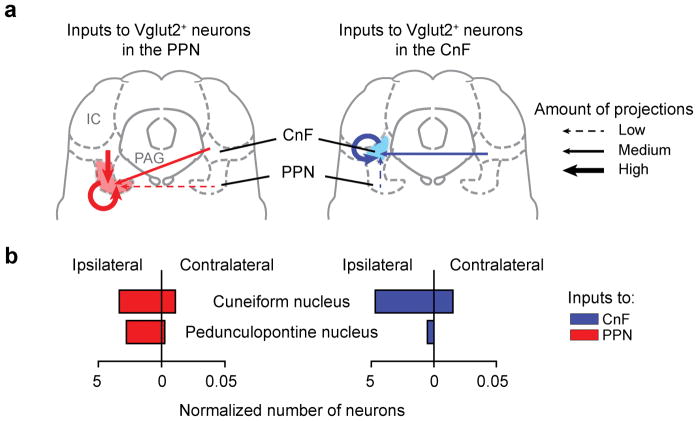
Extended Data Figure 8. Connectivity between PPN and CnF.
a, b, AAV-EF1a-FLEX-GTB helper virus followed by EnvA G-deleted-Rabies-mCherry virus were unilaterally injected in the PPN (left, red) or the CnF (right, blue) in Vglut2Cre mice to trace inputs to glutamatergic neurons. a, Schematics summarising the inputs to PPN- Vglut2-Ns (red) and CnF-Vglut2-Ns (blue) neurons. The thickness of the arrows indicates the amount of connectivity based on the counts of the normalized number of neurons (b). Dashed arrows indicate sparse connectivity. CnF, cuneiform nucleus; IC, inferior colliculus; PAG, periaqueductal grey; PPN, pedunculopontine nucleus.

