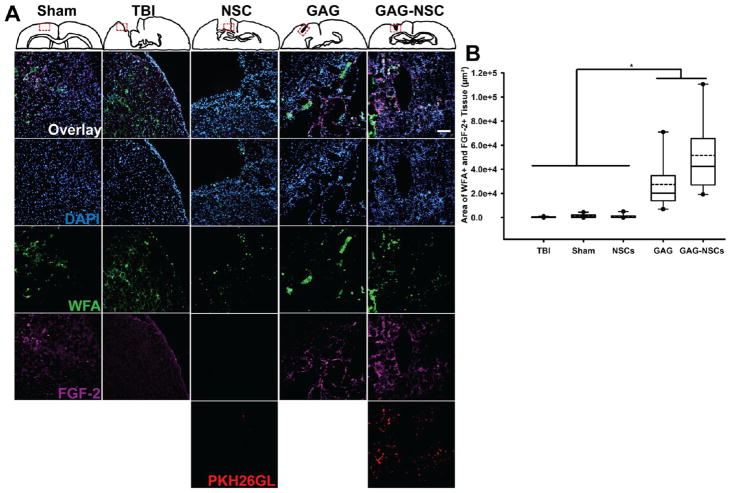
Figure 4.
FGF2 presence in brain tissue. (A) Representative images of the region corresponding to the red dotted box in coronal brain sections obtained from sham animals, and surrounding the lesion area in coronal brain sections obtained from TBI only, NSC only, CS-GAG only, and CS-GAG-NSC treated animals. Cellular nuclei are represented by DAPI (blue); CS-GAG and GalNAc presence is indicated by WFA labeling (green); and FGF2 labeling is indicated in magenta. Merged overlays are presented in the topmost panel. A significantly greater FGF2+ area was visualized in brain sections obtained from CS-GAG and CS-GAG-NSC treated animals when compared to sham and TBI only controls, and NSC only treated animals. Statistical significance is represented by ‘*’, which indicates p < 0.05. Scale = 100 μm.

