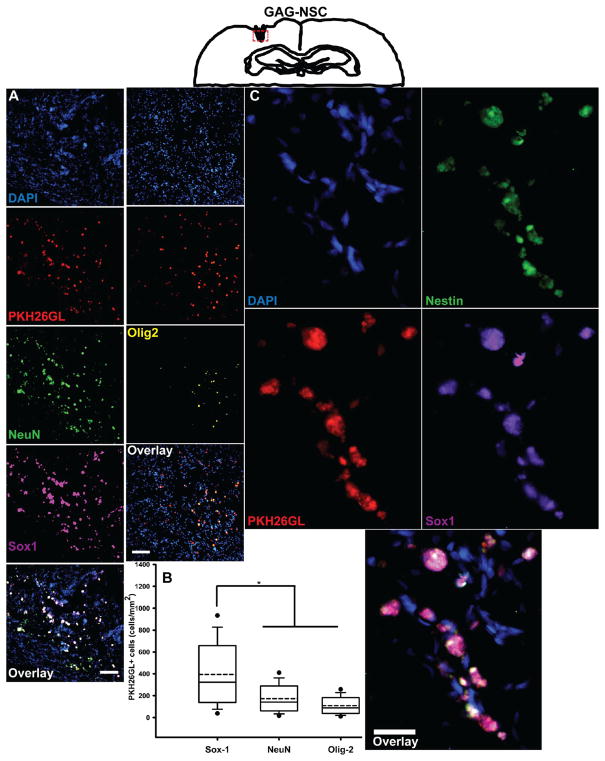
Figure 5.
Differentiation of NSCs transplanted in CS-GAG matrices. Representative images of the region corresponding to the red dotted box surrounding the lesion area in coronal brain sections obtained from CS-GAG-NSC treated animals. (A) Represents the neural cell differentiation of transplanted NSCs. Cellular nuclei are represented by DAPI (blue); transplanted NSCs are represented by PKH26GL labeled cells (red); NSCs differentiating into neurons are represented by NeuN labeling (green); NSC differentiating into oligodendrocytes are represented by the Olig2 label (yellow); undifferentiated NSCs are represented by the Sox1 label (magenta); Merged overlays are presented in the bottom most panels. Scale = 100 μm. (B) A significantly greater number of NSCs delivered in CS-GAG matrices maintained their undifferentiated state as demonstrated by the maintenance of Sox1 expression when compared to NSCs that differentiated into neurons or oligodendrocytes. Statistical significance is represented by ‘*’, which indicates p < 0.05. (C) High-magnification images of PKH26GL+ transplanted NSCs in the lesion site coexpressing the NSC markers Sox1 and nestin. Scale = 20 μm.

