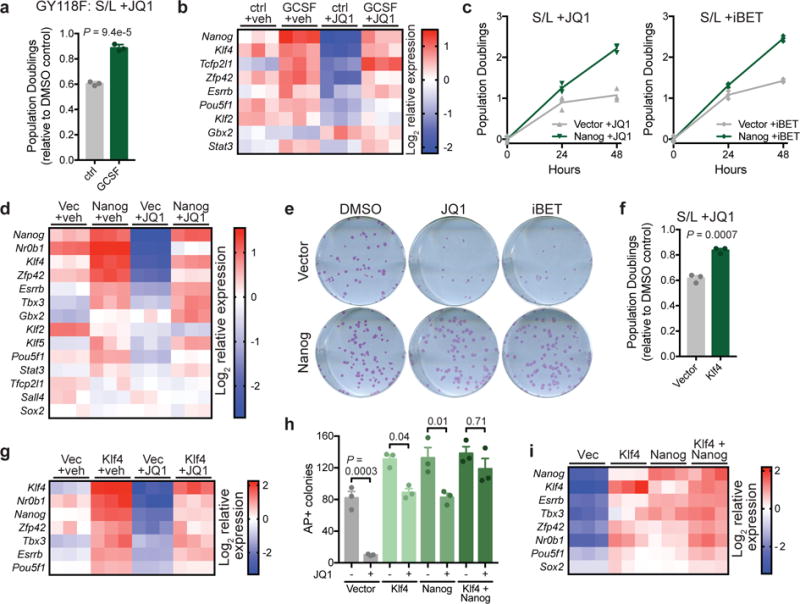
Figure 5. Increased transcription factor activity provides resistance to BET inhibition in the absence of 2i.

(a) Population doublings of cells expressing GCSF-activated LIFR transgene (GY118F) cultured with or without GCSF and treated for 48 h with 500 nM JQ1 relative to vehicle (DMSO)-treated controls. (b) Heat map depicting relative gene expression in cells expressing GCSF-activated LIFR transgene (GY118F) treated for 24 h with vehicle (DMSO) or 500 nM JQ1. (c) Growth curve of ESCs expressing empty vector or Nanog and cultured with 500 nM JQ1 (left) or 500 nM iBET (right). n=3 independent samples are shown and the connecting line joins the mean values of each time point. (d) Heat map depicting relative gene expression in cells expressing empty vector or Nanog and treated with vehicle (DMSO) or 500 nM JQ1 for 24 h. (e) Alkaline phosphatase staining of colony formation assays in which vector or Nanog-expressing cells are treated for the final 48 h with vehicle (DMSO), JQ1 or iBET. Experiment was performed at least two times with similar results. (f) Population doublings of cells expressing empty vector or Klf4 treated for 48 h with 500 nM JQ1 relative to vehicle (DMSO)-treated controls. (g) Heat map depicting relative gene expression in cells expressing empty vector or Klf4 and treated with vehicle (DMSO) or 500 nM JQ1 for 24 h. (h) Quantification of number of alkaline phosphatase (AP)-positive colonies formed in the presence of continuous JQ1 in cells expressing empty vector, Klf4, Nanog or Klf4+Nanog. (i) Heat map depicting relative gene expression in cells shown in (h) treated with 500 nM JQ1 for 24h. Data are presented as mean ± SD (a) or SEM (f,h) of n=3 independent samples. Statistics calculated by unpaired, two-tailed Student’s t-test (a,f) or 1-way ANOVA with Tukey’s post-test (h).
