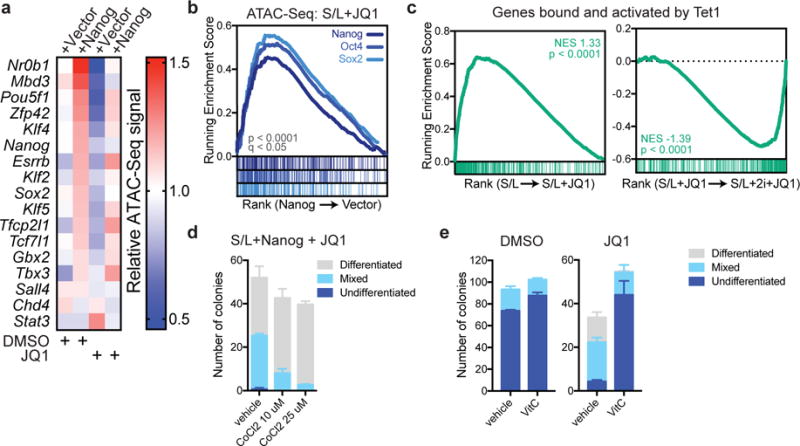
Figure 6. JQ1 affects Nanog and Tet target genes.

(a) Relative chromatin accessibility at peaks associated with key pluripotency genes in ESCs expressing empty vector or Nanog and treated with DMSO or 500 nM JQ1 for 72 h. See also Supplementary Table 5. (b) Gene set enrichment analysis (GSEA) showing genes ranked by fold change in total accessibility with Nanog overexpression as measured by ATAC-Seq of duplicate samples. Genes identified as direct targets of Nanog, Oct4 and Sox2 are enriched among genes whose accessibility is increased by Nanog overexpression. (c) Gene set enrichment analyses of RNA-Seq data from triplicate samples showing enrichment of genes identified as bound and activated by Tet1. For GSEA, P values are calculated based on 1000 permutations by the GSEA algorithm and was not adjusted for multiple comparisons. (d) Colony formation assay of Nanog-overexpressing cells cultured in the presence of 500 nM JQ1 and indicated dose of CoCl2 for 6 days. (e) Colony formation assay of Nanog-overexpressing cells cultured in the presence of DMSO or 200 nM JQ1 and 100 μg/mL Vitamin C for 6 days. Data are presented as mean ± SEM of n=3 independent samples.
