
Figure 7. Tet1/2 are required for resistance to BET inhibitors.
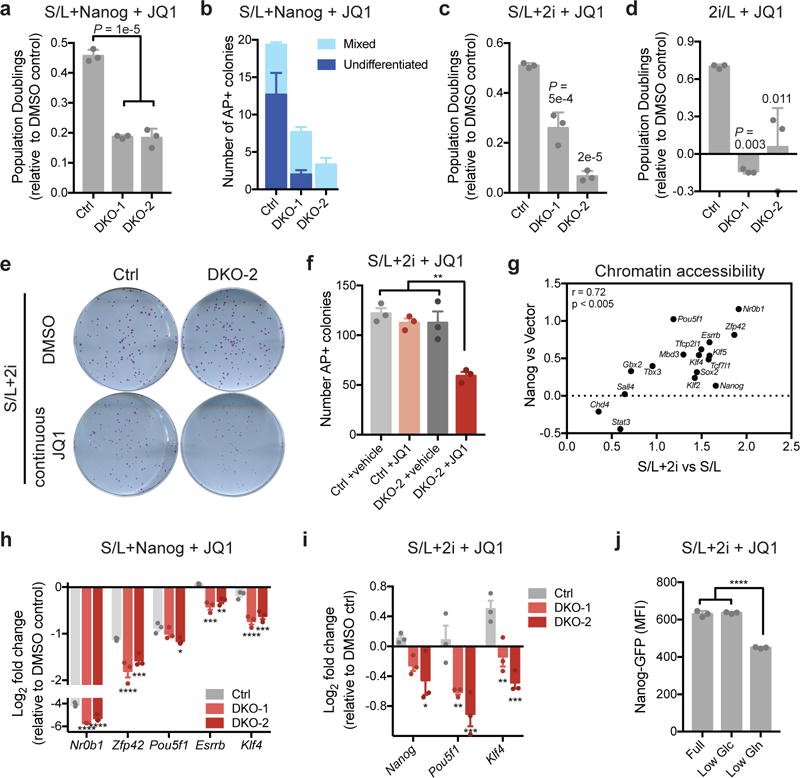
(a) Population doublings of JQ1-treated ESCs relative to DMSO controls during day 4-6 of treatment with 500 nM JQ1. All cells express Nanog and are cultured in S/L. (b) Quantification of number of alkaline phosphatase (AP)-positive colonies with mixed or undifferentiated morphology formed in the presence of continuous JQ1 treatment in control or Tet1/2 double mutant (DKO) ESCs expressing Nanog. (c and d) Population doublings of JQ1-treated ESCs relative to DMSO controls during day 4-6 of treatment with 500 nM JQ1. Cells are cultured in S/L+2i (c) or 2i/L (d). (e and f) Images (e) and quantification (f) of alkaline phosphatase (AP)-positive colonies formed in the presence of continuous JQ1 treatment in control or Tet1/2 DKO ESCs cultured in S/L+2i. (g) Relative chromatin accessibility in JQ1-treated ESCs assessed by ATAC-seq. All peaks associated with each gene were summed and plotted as the log2 fold change of accessibility with each treatment relative to control (Nanog overexpression or 2i culture). (h and i) Expression of pluripotency genes in Nanog expressing (h) or S/L+2i cultured (i) ESCs treated with 500 nM JQ1 for 72 h relative to DMSO controls. (j) Nanog-GFP expression in JQ1-treated ESCs cultured in S/L+2i in full medium (20 mM glucose, 2 mM glutamine) or medium with reduced glucose (included as a control; Low Glu, 2 mM) or reduced glutamine (Low Gln, 200 μM). Data are presented as mean ± SEM (b, f, h, i) or ± SD (a, c, d, j) of n=3 independent samples. *, p < 0.05; **, p < 0.005; ***, p < 0.0005; ****, p < 0.0001 by 1-way ANOVA (a, c, d, f, j) or 2-way ANOVA (h, i) with Tukey’s multiple comparison post-test.