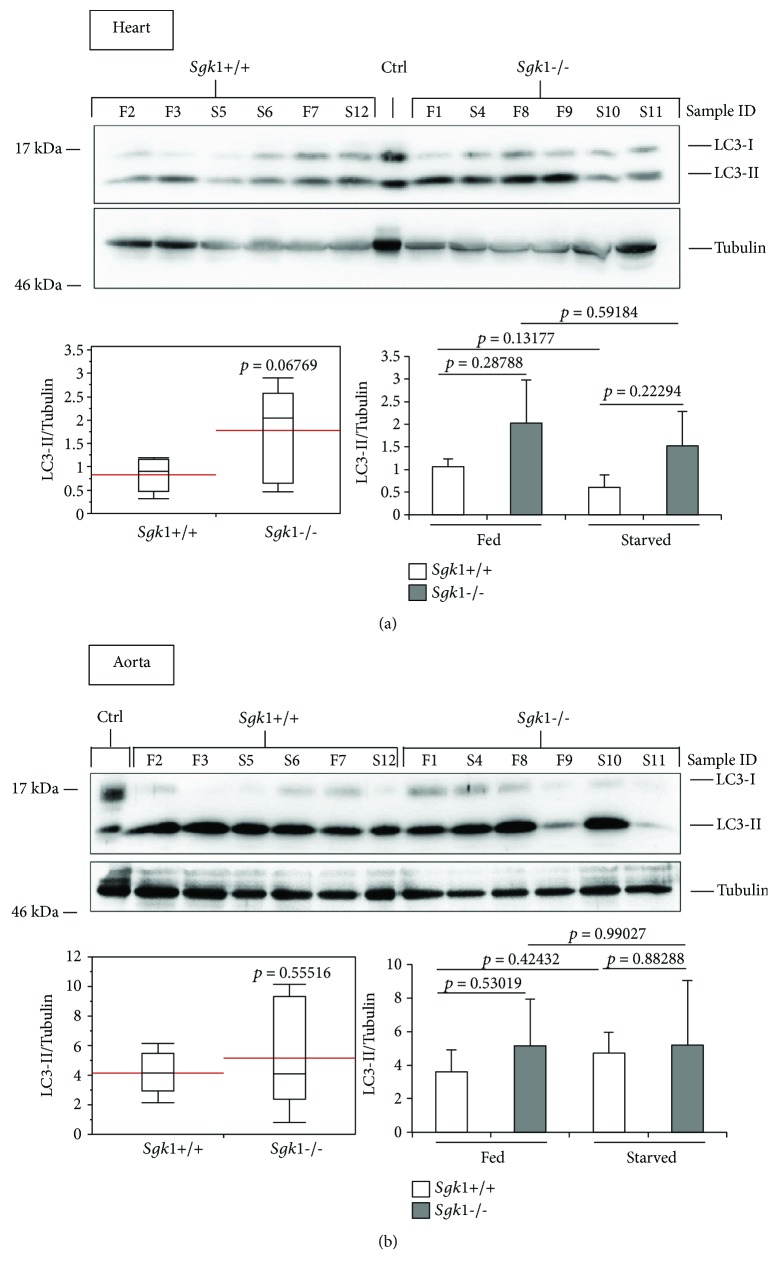
Figure 3.
LC3 lipidation is unaltered in the heart and aorta tissue derived from Sgk1 knockout mice. LC3 lipidation was analysed by Western blotting (upper panel) and quantified (lower panels) in protein extracts from the heart (a) or aorta (b) of 6 Sgk1 knockout (Sgk1−/−) and wild-type (Sgk1+/+) mice. Of those, 3 mice were either fed (F) or starved (S) as indicated (sample ID). LC3-positive control (Ctrl) was used to indicate the migration of nonlipidated LC3-I and lipidated LC3-II. Red lines on the box plots (lower panel, left) represent the mean values of all 6 Sgk1 knockout (Sgk1−/−) and wild-type (Sgk1+/+) mice (lower panel, left) or with regard to fed and starved conditions (lower panel, right). p values are provided. Supporting data is provided (Suppl. Data Set).

