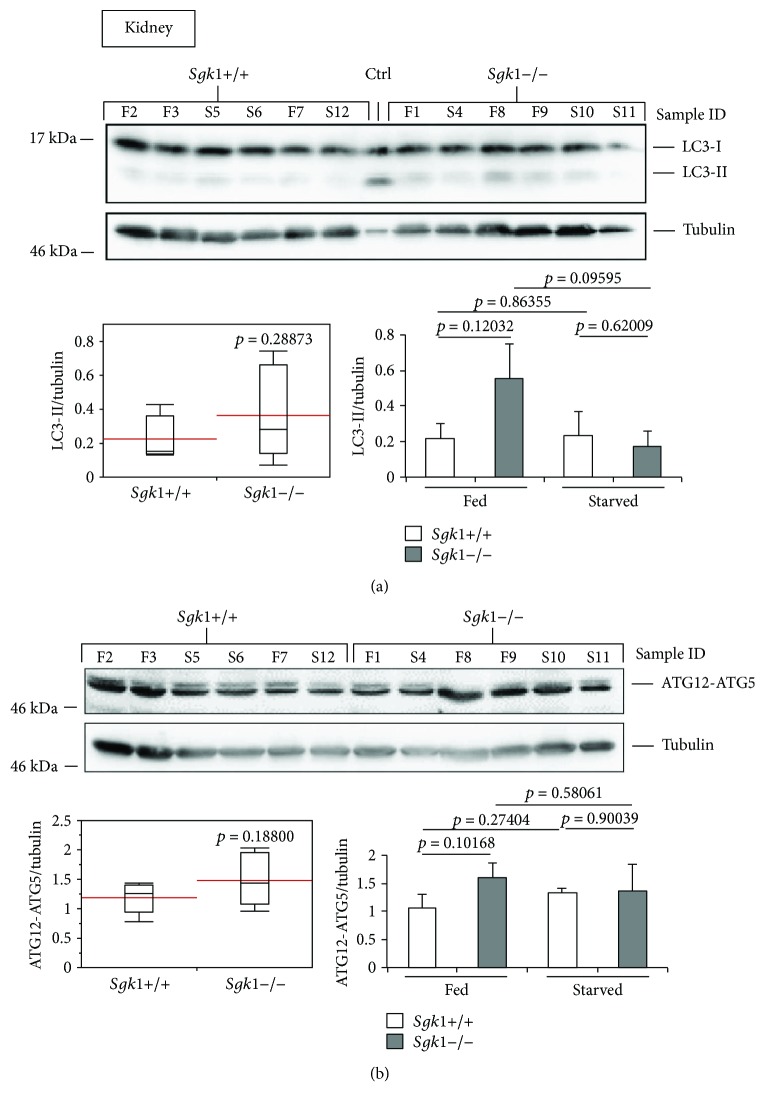
Figure 4.
LC3-II and ATG12-ATG5 abundances are unaltered in the mouse kidney of Sgk1 knockout mice. LC3 lipidation (a) and ATG12-ATG5 (b) abundances were analysed by Western blotting (upper panel) and quantified (lower panels) using Sgk1 knockout (Sgk1−/−) and wild-type (Sgk1+/+) mice (n = 6). Of those, mice were either fed (F, n = 3) or starved (S, n = 3) as indicated (sample ID). LC3-positive control (Ctrl) was used to indicate the migration of nonlipidated LC3-I and lipidated LC3-II. Red lines on the box plots (lower panel, left) represent the mean values of all 6 Sgk1 knockout (Sgk1−/−) and wild-type (Sgk1+/+) mice (lower panel, left) or with regard to fed and starved conditions (lower panel, right). p values are provided. Supporting data is provided (Suppl. Data Set).

