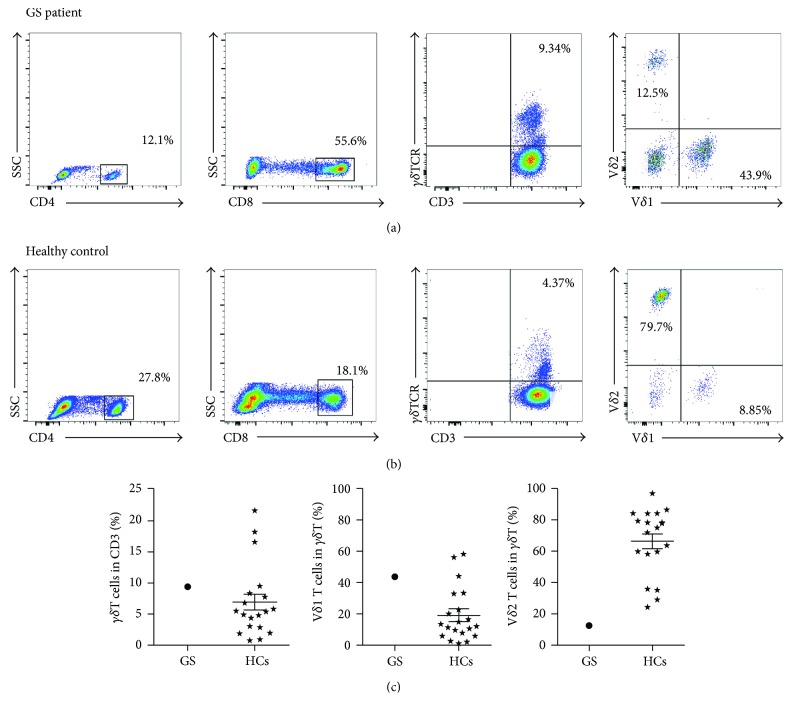
Figure 2.
Distribution of peripheral blood immune cells in this GS patient and HCs. Representative of dot pots of CD4+ T cell, CD8+ T cell, γδT cell, and its subgroups (Vδ1, Vδ2) in our GS patient (a) and HCs (b). Detailed statistical graphs of γδT cells and its subgroups in this GS patient and HCs (c; N = 20). ⋆: HCs group.

