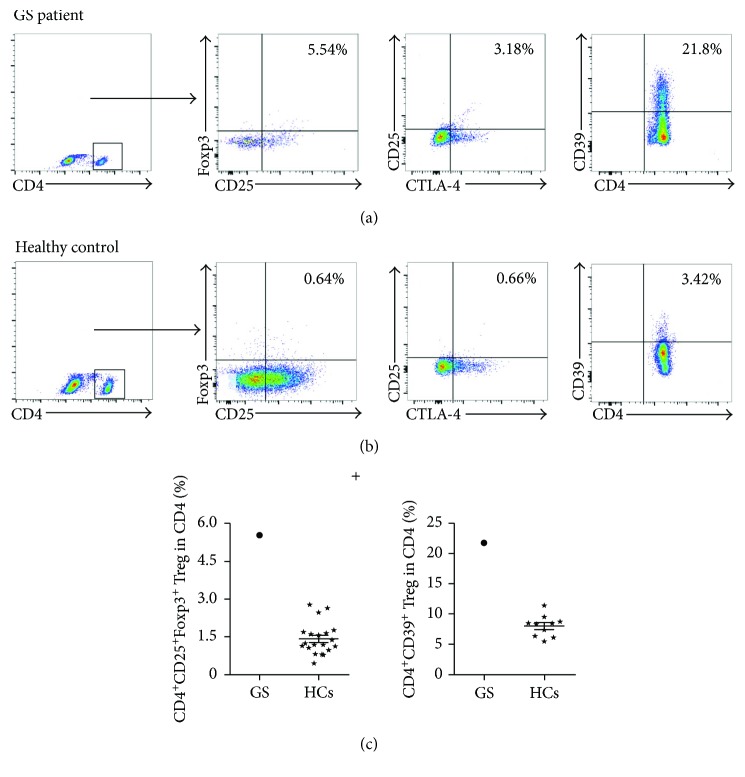
Figure 3.
Elevated levels of peripheral CD4+ Tregs in this GS patient and HCs. Representing plots of three main markers of CD4+ Treg cell subgroups in our GS patient (a) and HCs (b), respectively. The percentages of CD4+CD25+Foxp3+ Tregs (N = 20) and CD4+CD39+ Treg (N = 10) in this GS patient and HCs (c). ⋆: HCs group.

