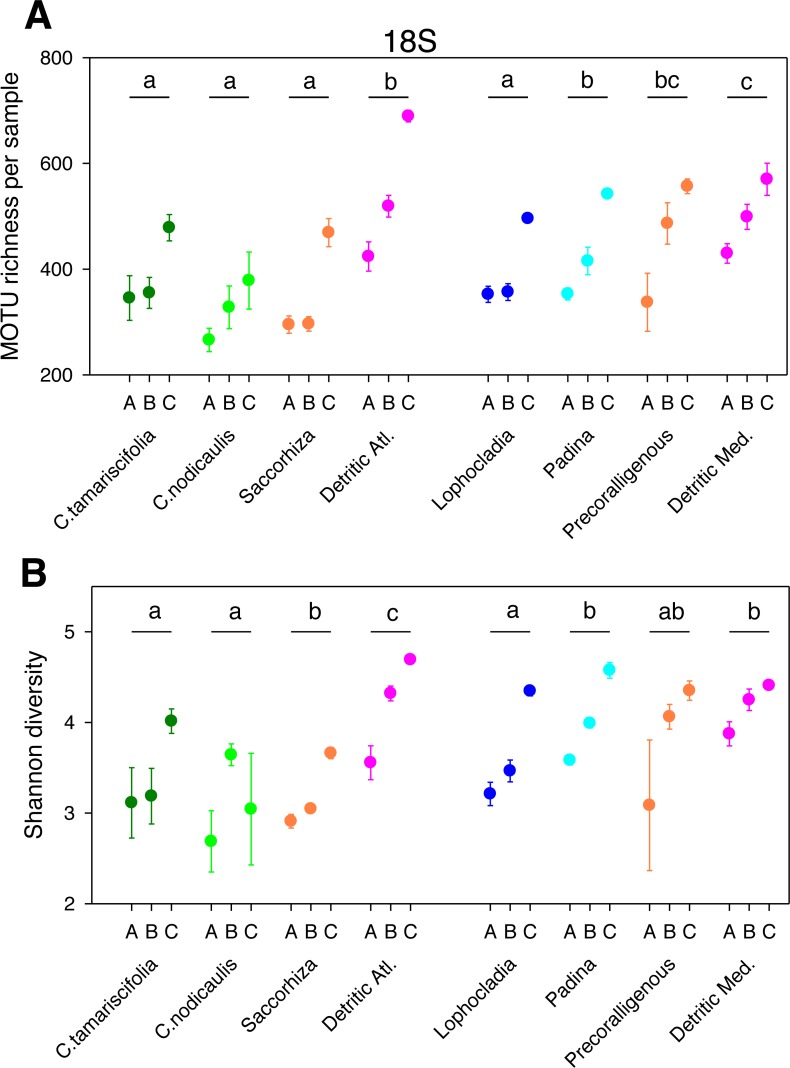
Figure 1. Scatter plots showing patterns of MOTU richness (A) and Shannon diversity index (B) for the 18S gene.
Results from eight different sublittoral communities (means ± SE shown). Fraction A, coarse; B, intermediate; C, fine. MOTU richness results obtained by rarefaction analysis to 19,000 reads per sample. Whenever a significant community effect was found in the PERMANOVA analyses (Table 2), the letters above the communities represent groups not significantly different in a post-hoc pairwise test within each National Park.

