Figure 4.
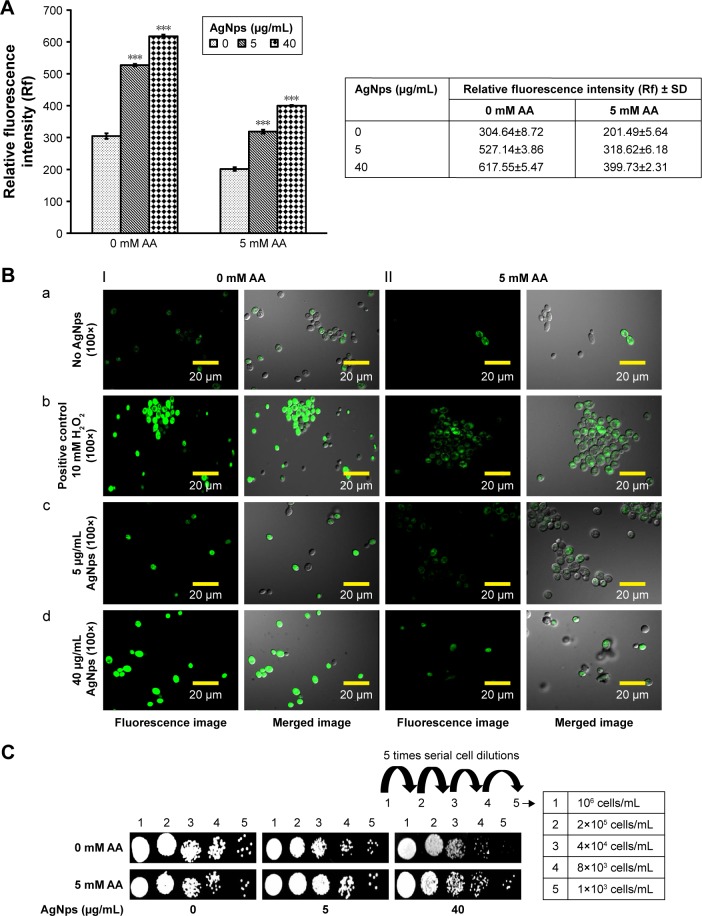
Intracellular ROS production in the Candida cells grown in the absence and presence of 5 μg/mL (subinhibitory) and 40 μg/mL (MIC90) AgNps estimated using the fluorescent dye DCFDA. (A) Quantitative measurement of endogenous ROS in AgNp-treated and untreated (control) Candida cells without addition of antioxidant and with addition of 5 mM antioxidant, AA. ROS levels are measured as Rf intensity and y-axis depicts the mean Rf values ± SD of three sets of independent experiments. Rf intensity was calculated by subtracting the Rf intensity for cells incubated without DCFDA (blank) from Rf intensity for cells incubated with DCFDA.55 *** represents p<0.001 calculated with respect to “no AgNps” (control). (B) Confocal images showing green fluorescence for endogenous ROS in Candida cells grown in the absence (B, panel a) and presence of 5 and 40 μg/mL AgNps (B, panels c and d), respectively, without antioxidant (I, left two panels) and with 5 mM AA (II, right two panels). Each left panel of both I and II depicts the fluorescence intensity (higher fluorescence indicates higher ROS production) measured by a confocal microscope and each right panel of both I and II shows the merge for the phase-contrast micrographs and fluorescence images at magnification 100×. The obtained results were compared with untreated cells (no AgNps; B, panel a) and positive control (cells treated with 10 mM hydrogen peroxide, H2O2; B, panel b). (C) AgNp susceptibility profiling of Candida cells grown in the absence and presence of 5 mM AA using spot assay. AgNps were used at respective concentrations of 5 μg/mL (subinhibitory) and 40 μg/mL AgNp (MIC90).
Abbreviations: AA, ascorbic acid; AgNps, silver nanoparticles; DCFDA, 2,7,dichlorofluorescein diacetate; MIC, minimum inhibitory concentration; Rf, relative fluorescence; ROS, reactive oxygen species.

