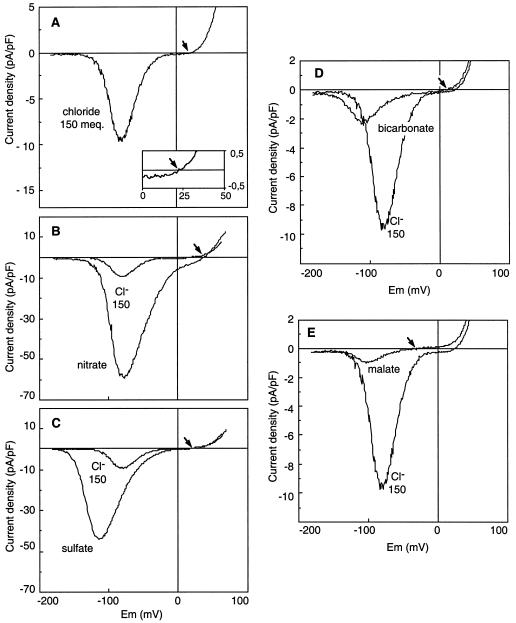
Figure 1.
Current-voltage relationships of the voltage-dependent anion channel for various intracellular anions. Whole-cell currents were measured on hypocotyl epidermal protoplasts. The currents result from a 10-s voltage ramp from −180 mV to +80 mV applied at the plasma membrane. I-V curves were obtained in the presence of 150 meq Cl− (A), 150 meq NO3− (B), 150 meq SO42− (C), 150 meq HCO3− (D), or 150 meq malate2− (E). For comparison, each I-V curve is presented with the Cl− current corresponding to 150 meq Cl−. Note the different current scalings for A and B, C and D, and E. The bath solution contained 110 mm Cl− and the pipette solution contained 5 mm ATP, 5 mm GTP, 150 meq of the anion to be tested, and 12.4 mm Cl−. Representative I-V curves from data sets of five to 10 independent recordings for each anion are shown, and arrows indicate the position of Erev on the voltage axis. The inset in A shows an expanded picture of the Erev region.

