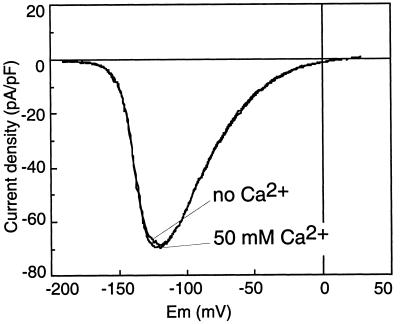
Figure 4.
Characteristics of the current-voltage relationship in the presence or absence of extracellular Ca2+. A 10-s voltage ramp between −180 mV to +30 mV was applied every 30 s. The pipette solution contained: 5 mm ATP, 5 mm GTP, 75 mm SO42−, and 12.4 mm Cl−. The I-V curve was recorded in the standard bath (50 mm CaCl2 and 5 mm MgCl2) 10 min after breaking to the whole-cell configuration when a stable current amplitude was reached (50 mm Ca2+), and after 5 min of perfusion with the Ca2+-free bath (no Ca2+) (95 mm TEA-Cl, 5 mm LaCl3). Results are shown for one representative experiment out of three. In all cases, the current amplitude was unchanged and the Erev was not significantly modified.

