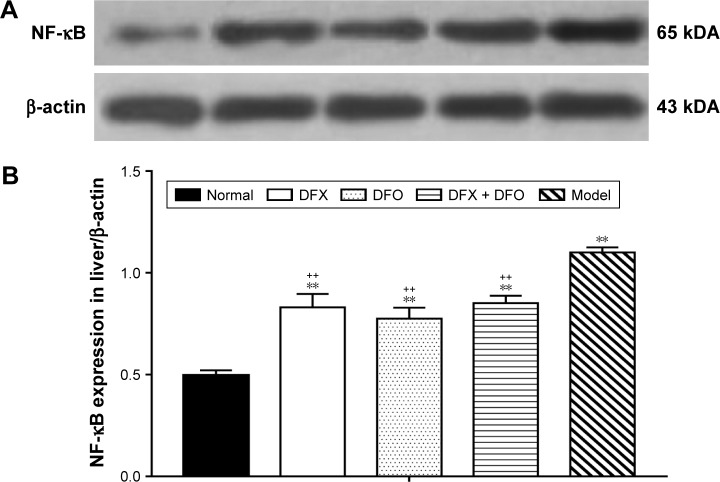
Figure 4.
Comparison of liver NF-κB expression among different groups.
Notes: (A) Liver expression of NF-κB was detected by Western blot, and the results were analyzed using ImageJ 1.46r software. Relative abundance of the proteins was expressed relative to β-actin. (B) Data are shown as mean ± SEM (n=3), **P<0.01 (as compared with Normal); ++P<0.01 (as compared with Model); Normal: Normal control group, DFX: DFX-treated group, DFO: DFO-treated group, DFX + DFO: DFO and DFX cotreated group, Model: Composite model group.
Abbreviations: DFO, deferoxamine; DFX, deferasirox; SEM, standard error of the mean.

