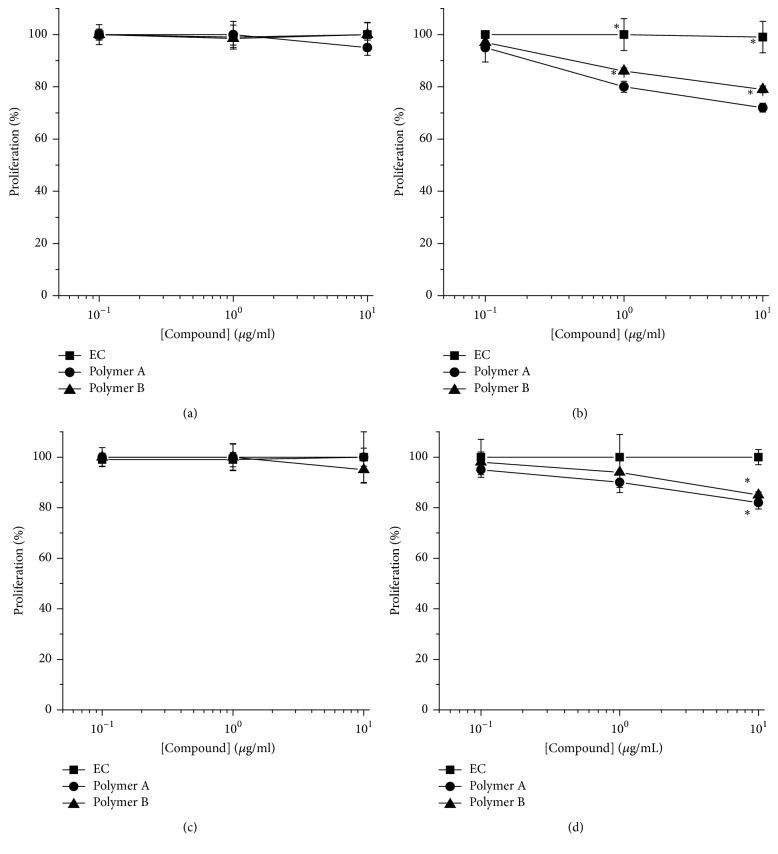
Figure 3.
Oligomers effects on A375 (a and b) and WM266-4 (c and d) proliferation. Cells were treated with increasing concentrations (0.1–10 μg/ml) of polymers A and B or EC for 3 (a and c) and 6 days (b and d). Cell proliferation was analysed by 3-(4,5-dimethylthiazol-2-yl)-2,5-diphenyl-tetrazolium bromide (MTT) assay and results were expressed as mean of percentage of the number of cells with respect to control cells. Data are shown as mean ± SEM. ∗p < 0.05.

