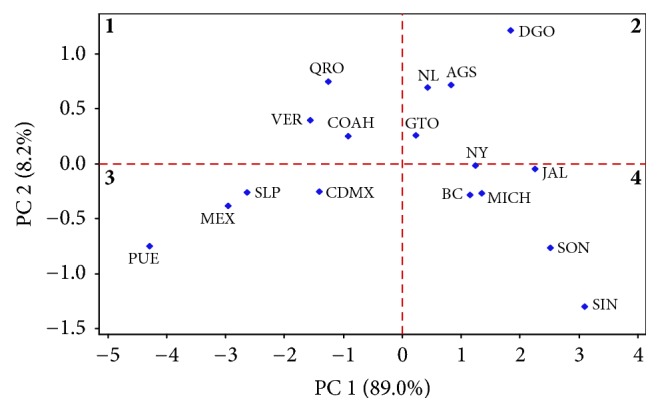
Figure 3.

Principal Component Analysis (PCA) of the ABO and D alleles. Samples were clustered into four groups according to PC1 and PC2 which explains 97.2% of the variability among populations; groups one and two do not exhibit geographical clustering; however, groups three and four show regional clustering in the south-center and east (group 3) and west and northwest (group 4). BC = Baja California; SON = Sonora; SIN = Sinaloa; DGO = Durango; NAY = Nayarit; COAH = Coahuila; JAL = Jalisco; MICH = Michoacan; NL = Nuevo Leon; GTO = Guanajuato; AGS = Aguascalientes; QRO = Queretaro; SLP = San Luis Potosi; VER = Veracruz; MEX = Estado de Mexico; PUE = Puebla; CDMX = Ciudad de Mexico.
