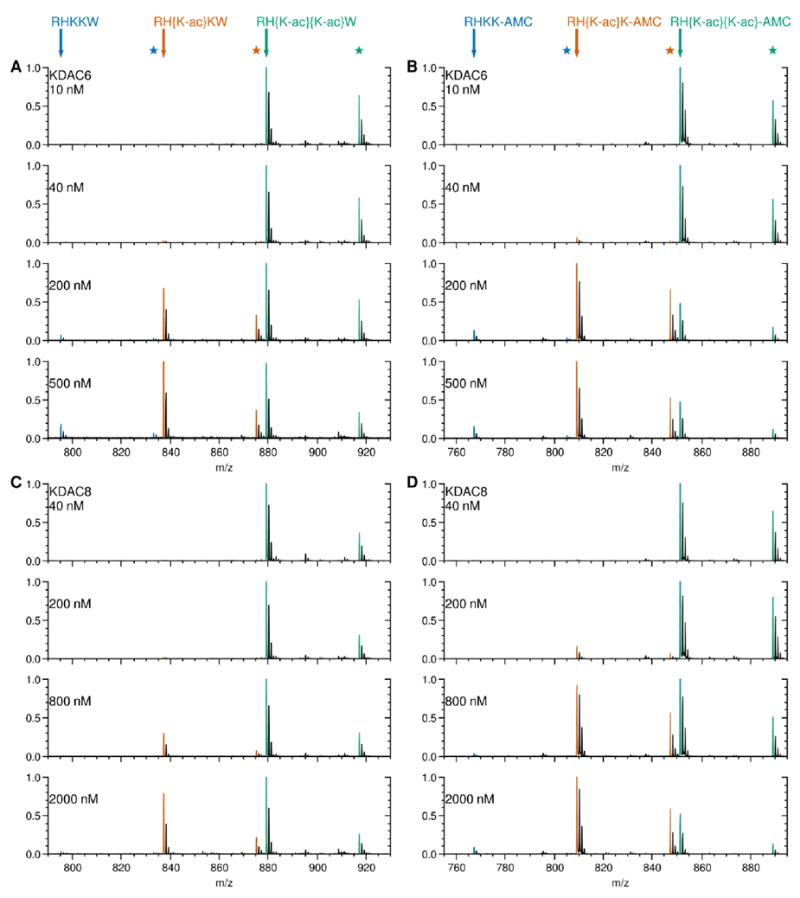
Figure 3. Deacetylation of doubly acetylated peptide substrates monitored by MALDI MS.

Several concentrations of KDAC were reacted with 50 μM doubly acetylated peptides in the following pairs: KDAC6 with RH{K-ac}{K-ac}W (A), KDAC6 with RH{K-ac}{K-ac}-AMC (B), KDAC8 with RH{K-ac}{K-ac}W (C), and KDAC8 with RH{K-ac}{K-ac}-AMC (D). After reactions were stopped, they were subjected to MADLI mass spectrometry as described in the methods. Peptides were detected based on m/z and identified based on theoretical masses of the M+H+ ion for each. Peaks representing the masses of the monoisotopic peptides are highlighted for the substrate (green), singly deacetylated product (orange), and doubly deacetylated product (blue). The theoretical peptide mass for each is indicated by an arrow. Stars represent the mass of the corresponding potassium adducts, observed due to the high salt concentration of the samples from the reaction buffer. For each reaction, the most intense signal was set to 1.0, and all other signals were normalized to it. The progression of the singly acetylated product matches that expected from fluorescence data. The doubly deacetylated product is present for all pairs at the highest concentration of KDAC, albeit at very low levels compared to the other peptides.
