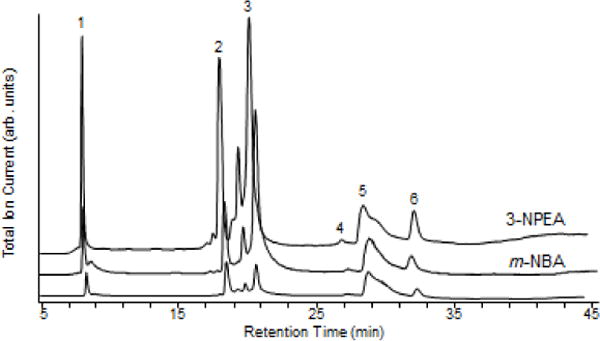
Figure 2.

LC/MS of protein mixture containing (1) 17 μM RNase A, (2) 13 μM ubiquitin, (3) 7.7 μM lysozyme, (4) 15 μM BSA, (5) 6.5 μM myoglobin, and (6) 7.6 μM carbonic anhydrase with 0.1% formic acid and 0.1% m-NBA and 0.1% 3-NPEA. No supercharging agent was added to the measurements represented by the bottom trace.
