Figure 1.

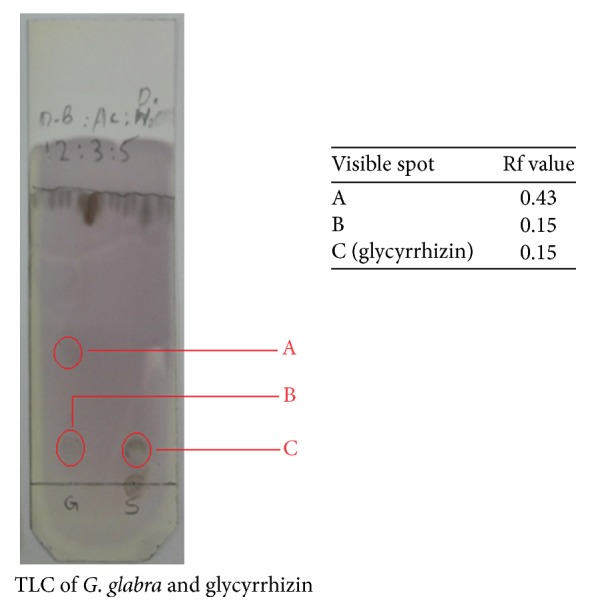
TLC profile for the analysis of G. glabra extract and glycyrrhizin using silica gel coated TLC plates and n-butanol : acetic acid : water (12 : 3 : 5) as the mobile phase.

TLC profile for the analysis of G. glabra extract and glycyrrhizin using silica gel coated TLC plates and n-butanol : acetic acid : water (12 : 3 : 5) as the mobile phase.