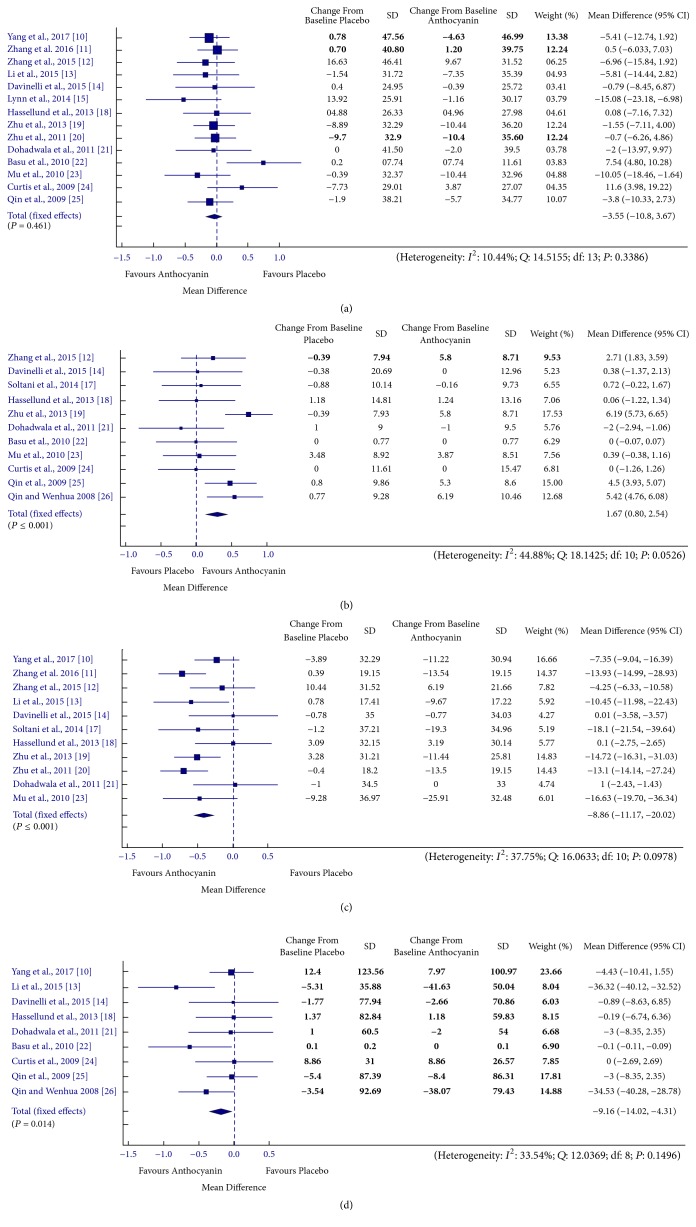
Figure 2.
Forest plot for anthocyanin versus placebo group changes in (a) total cholesterol, (b) HDL cholesterol, (c) LDL cholesterol, and (d) triglyceride. Pooled effect estimates are shown as diamonds and data are expressed as mean differences with 95% CI. Interstudy heterogeneity was tested by using the Cochran Q statistic (Chi2) at a significance level of P < 0.10 and quantified by the I2 statistic.

