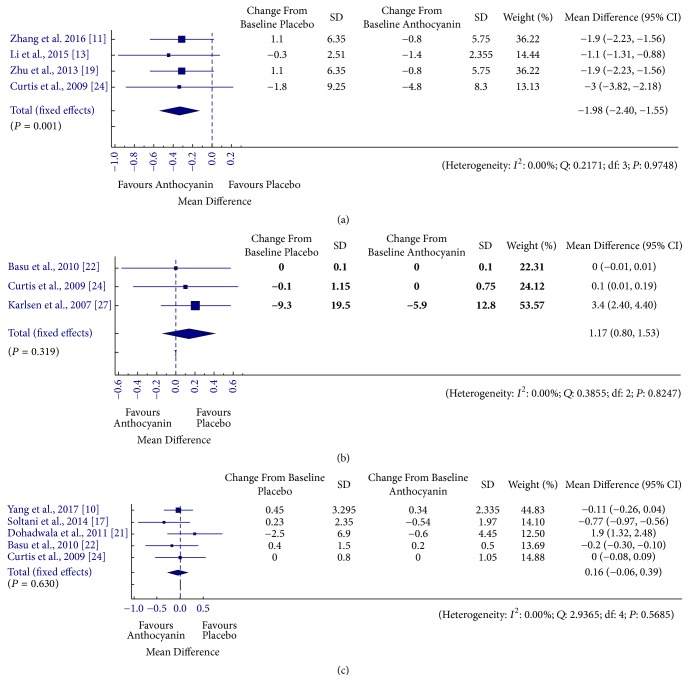
Figure 4.
Forest plot for anthocyanin versus placebo group changes in (a) TNF-∞, (b) IL-6, and (c) hs-CRP. Pooled effect estimates are shown as diamonds and data are expressed as mean differences with 95% CI. Interstudy heterogeneity was tested by using the Cochran Q statistic (Chi2) at a significance level of P < 0.10 and quantified by the I2 statistic.

