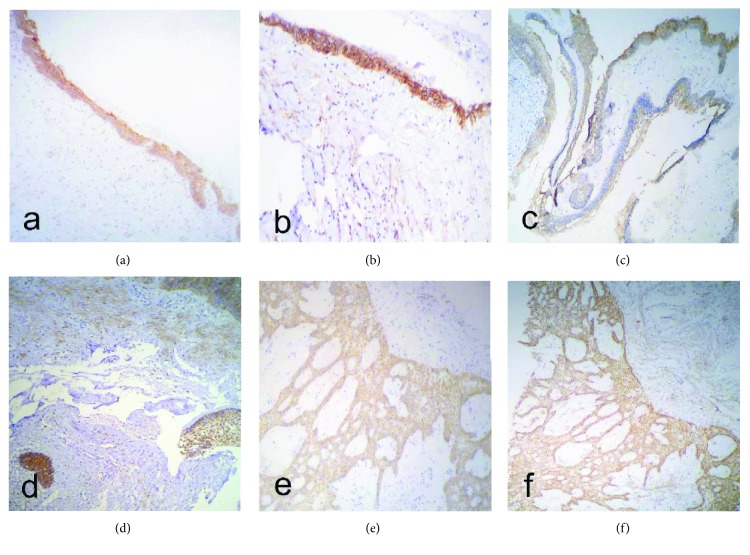
Figure 2.
Ameloblastomas in which the rates of E-cadherin and syndecan-1 expression were evaluated. (a) E-Cadherin expression in a luminal/intraluminal ameloblastoma. (b) Expression of epithelial and stromal syndecan-1 in a luminal/intraluminal ameloblastoma. (c) Expression of E-cadherin in a unicystic ameloblastoma with mural invasion. (f) Membrane expression intensity of E-cadherin in a unicystic ameloblastoma with mural invasion. (d) Expression of epithelial and stromal syndecan-1 in a unicystic ameloblastoma with mural invasion. (e) Expression of E-cadherin in a solid/multicystic ameloblastoma. (f) Epithelial and stromal expression of syndecan-1 in a solid/multicystic ameloblastoma.

