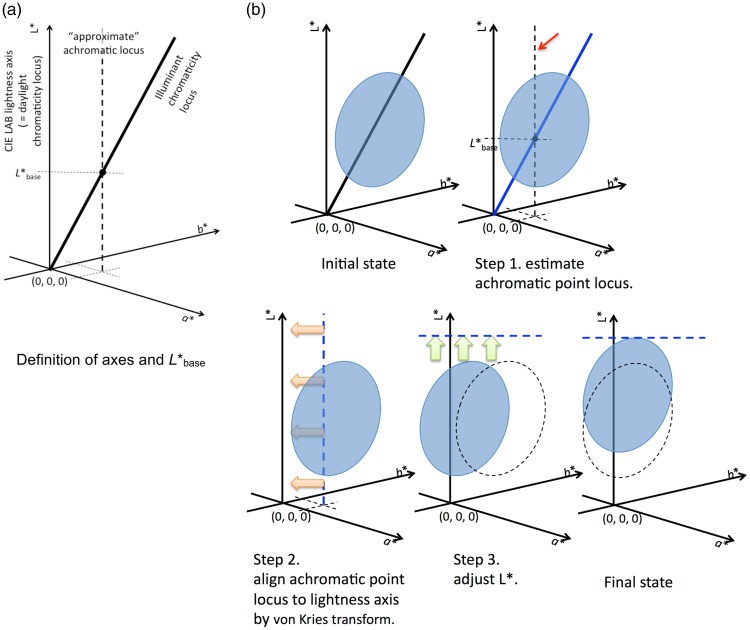
Figure 1.
Schematic diagram of color shift simulation in CIE LABD65 space. (a) Illuminant chromaticity locus does not coincide with lightness axis of CIE LAB space, normalized to D65 (CIE LABD65). Approximate achromatic locus is derived with . (b) Shaded ellipses represent gamut of an object in an image. Step 1: estimation of achromatic point locus, Step 2: alignment of achromatic point locus to lightness axis, and Step 3: adjustment of lightness differences. See text for details.

