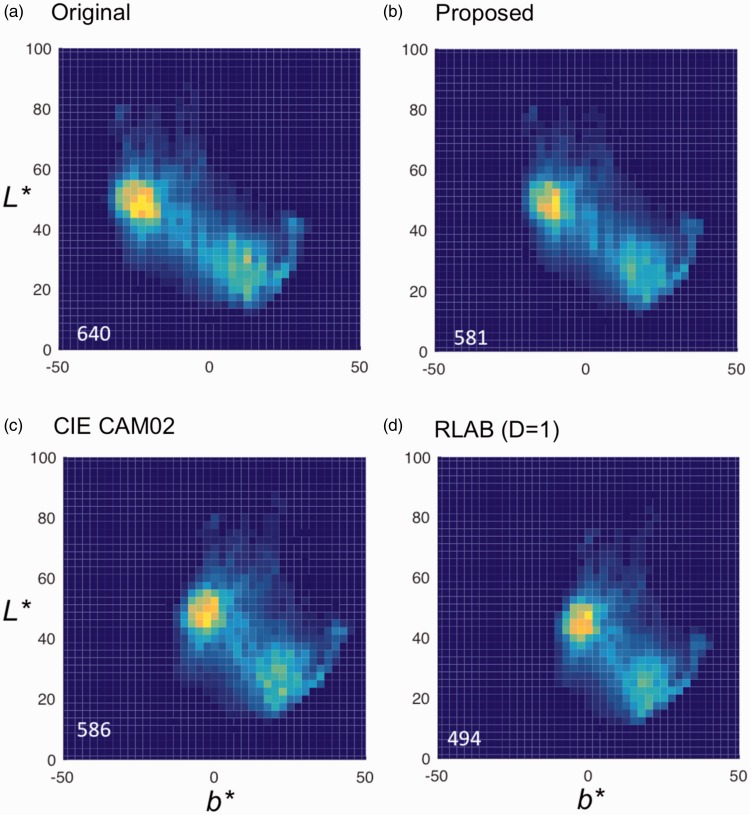
Figure 6.
Chromaticity distribution of images processed by each method. Heat maps show population of pixels in each chromaticity in the b*L* plane. The numbers at the bottom-left corner indicate number of cells (binned at 2.5 × 2.5 in b* and L* values) with nonzero values. CIE CAM02 (c) shows a slightly larger number than our method (b), but the gamut is clearly shrunk horizontally, as is that in RLAB (d). See also Table 3 for distance of the two modal points (dress-body and lace parts) in each distribution.

