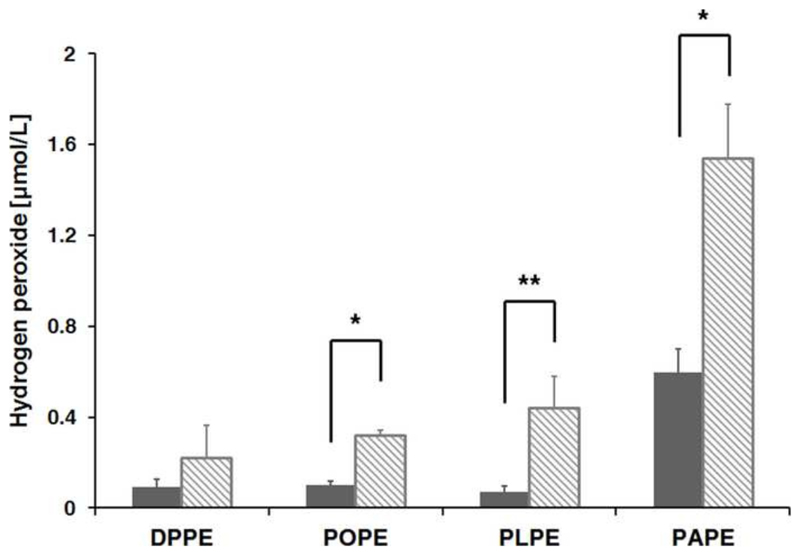
Figure 3. Water peroxide content in aqueous solution of glycated PE.
H2O2 was quantified in aqueous solutions of glycated DPPE, POPE, PLPE, PAPE (1 mmol/L; dashed bars) and the corresponding non-glycated controls (grey bars; samples incubated at 100°C without sugar). Experiments were performed in triplicate. Significant differences were assessed using t-test (* <0.001; **< 0.0005).

