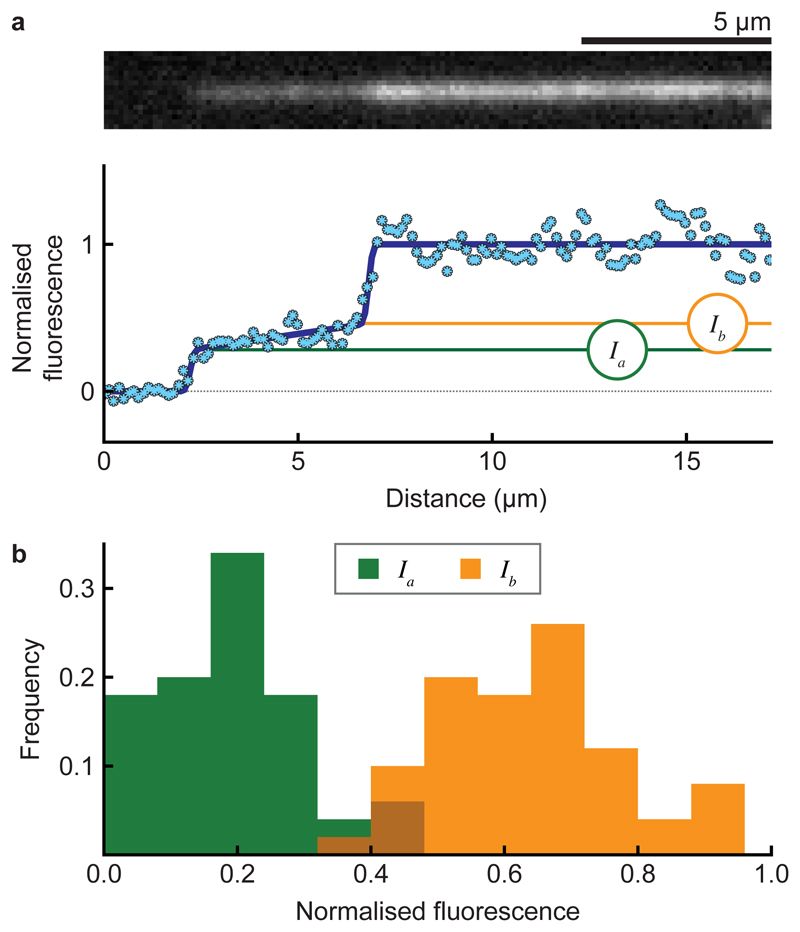
Figure 3. Subsets of protofilaments are stabilised by a kinesin-coated surface.
a, Model fit to the intensity profile of a microtubule tip (bottom) with the associated fluorescence image (top). (Ia) is the intensity at the tip and (Ib) at the base of the trail. b, Histogram of (Ia) and (Ib) values for microtubules (n = 50), normalised to the intensities of their parent microtubules in the no-nucleotide phase of the experiment. Mean ± SD is 0.19 ± 0.11 and 0.64 ± 0.13 for Ia and Ib, respectively.

