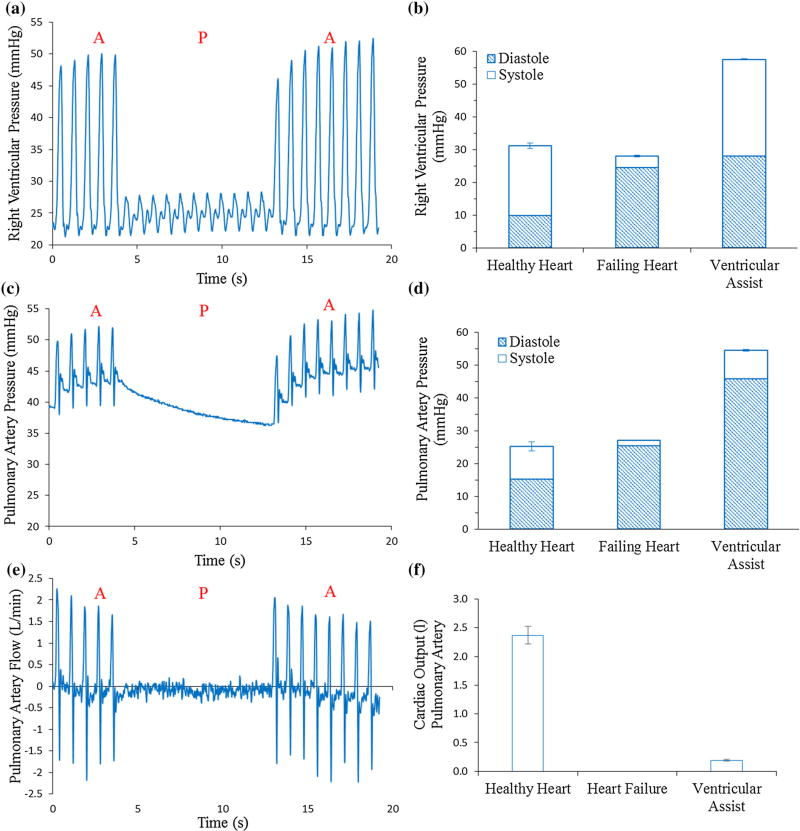
FIGURE 8.
RVED testing in RHF model resulting from volume overload. (a) Example of RV pressure showing periods of device actuation (A) and pause (P). (b) RV pressure in the healthy heart, the failing heart and the failing heart during device actuation conditions. (c) Example of PA pressure during heart failure showing periods of device actuation (A) and pause (P). (d) PA pressure comparing the healthy heart, the failing heart and the failing heart during device actuation conditions. (e) Example of PA flow during heart failure showing periods of device actuation (A) and pause (P). (f) PA flow comparing the healthy heart, the failing heart and the failing heart during device actuation conditions.

