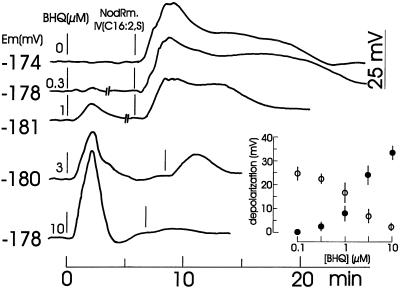
Figure 6.
Effect of BHQ at the indicated concentrations on the membrane potential (Em) of alfalfa root hairs before and after the addition of 0.1 μm NodRm-IV(C16:2,S). At “//” drawings of curves were interrupted for 2 to 3 min to allow for normalization of Nod factor addition. External [Ca2+] was 0.1 mm. Kinetics are representative examples of three to five recordings carried out under equivalent conditions. Inset, Dose-response relationship of maximal Nod factor- (○) and BHQ-induced depolarizations (•) are plotted against the BHQ concentration during the experiment.

