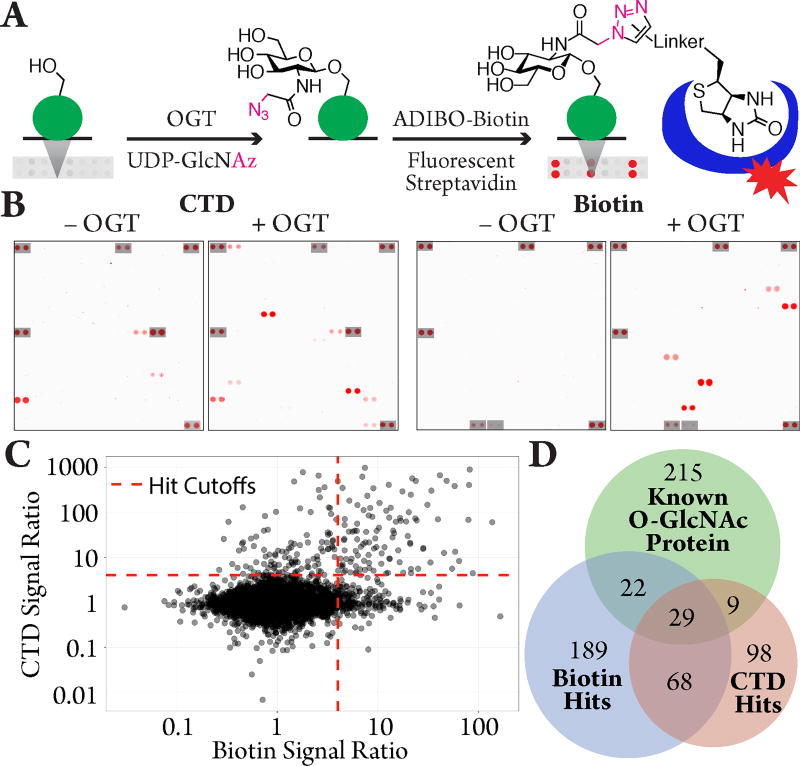
Figure 1.
Chemoenzymatic biotin labeling reduces background signal and improves detection A) Use of sugar analogue GlcNAz allows labeling with ADIBO-biotin and detection by fluorescent streptavidin (blue) B) Different sub-blocks from microarrays treated with or without OGT for antibody (CTD) or biotin detection methods. Grey boxes show control spots. C) Scatterplot comparing intensity ratios for the two detection methods for all proteins on the microarrays. Dashed red lines indicate hit cutoffs. D) Venn diagram of hits by each method compared to proteins on the microarray that are O-GlcNAcylated in cells.10

