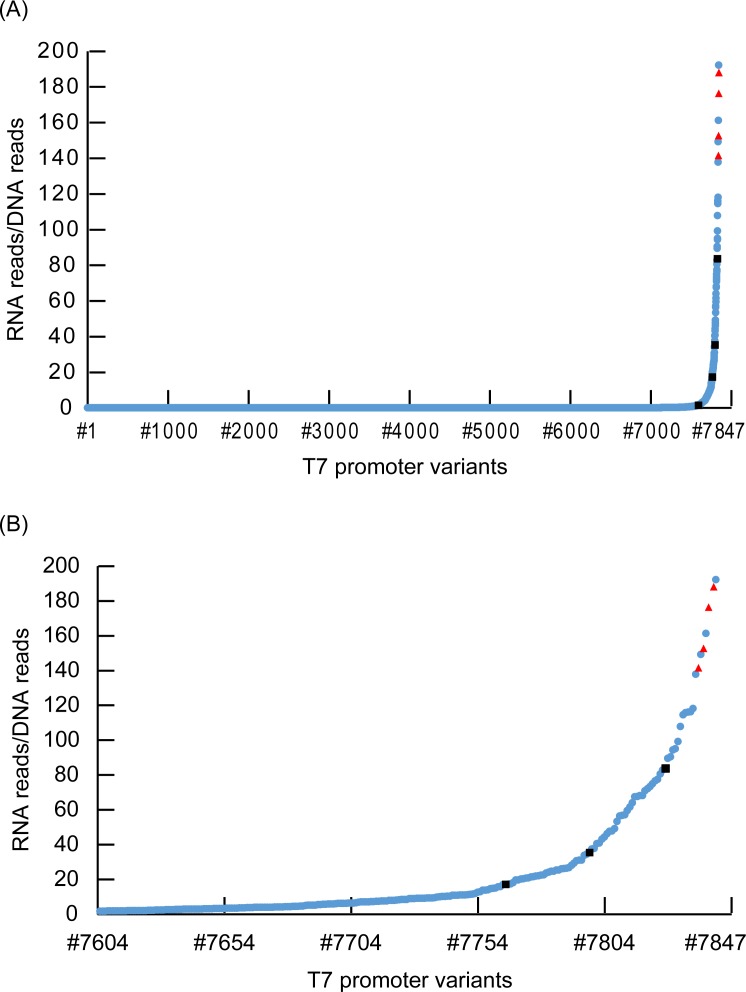
Fig 4. Distribution of the transcriptional activity of each T7 promoter variant sequence.
(A) Distribution of all T7 promoter variants. The vertical axis means the transcriptional activity. Transcriptional activity was defined as the number of RNA reads/DNA reads. All T7 variants (from #1 to #7847) were listed in order of transcriptional activity. Blue circle plots show transcriptional activity of each randomized T7 promoter sequence. Five red triangle plots show transcriptional activity of original T7 promoter sequence with different barcodes. Four Black square plots show T7 promoter sequences used in Fig 5 experiment. There is some overlap between plots. (B) Distribution of T7 variants from #7604 to #7847.

