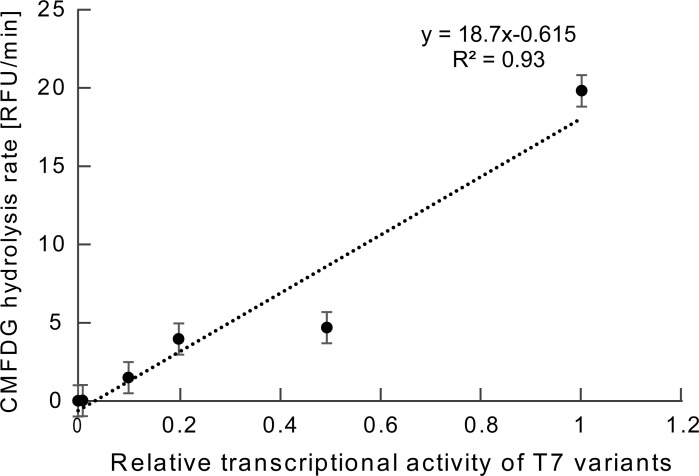
Fig 5. Correlation between the transcriptional activity and translational activity of LacZ gene with T7 promoter variant sequences.
The plot illustrates the correlation between the transcriptional activity versus translational activity of LacZ production for four T7 promoter variants. Their relative transcriptional activities are 0.5, 0.2, 0.1 and 0.01. We used original T7 promoter sequence as a standard. In addition, we carried out an experiment with no DNA fragment as a negative control, and the transcriptional activity was set as zero. The translational activity was measured as the hydrolysis rate of 5-chloromethylfluorescein di-β-d-galactopyranoside (CMFDG). Each plot was averaged across three independent experiments. The error bars indicate standard errors of the means. RFU means relative fluorescence units.

