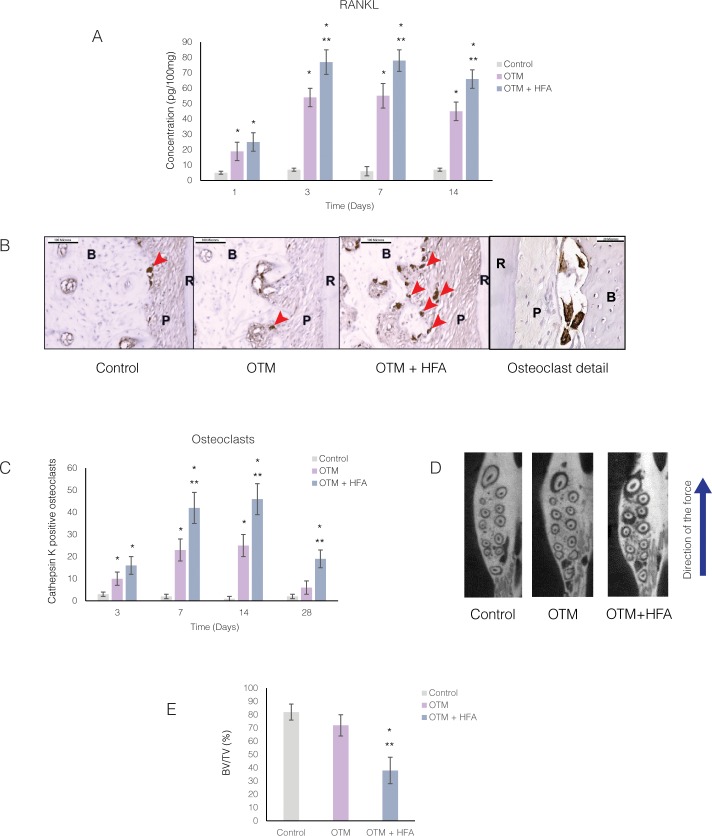
Fig 4. Osteoclast markers and number of osteoclasts increase in response to HFA mechanical stimulation.
(A) Mean concentration of RANKL protein in the maxillary right alveolar bone after 1, 3, 7 and 14 days as measured by ELISA. Data expressed as the mean ± SEM of RANKL concentration in picograms per 100 mg tissue of 5 samples. (* Significantly different from control; **significantly different from OTM group). (B) Light microphotographs of Cathepsin K–positive osteoclasts in immunohistochemically stained sections of mesiopalatal root of the maxillary first molar. Images were collected close to the alveolar crest 28 days after application of force. Osteoclasts are stained as brown multinucleated cells (arrow heads) in sections from different groups and in the detail higher magnification. (C) Mean number of osteoclasts at different time points, in PDL and adjacent alveolar bone of mesiopalatal root of maxillary first molar. Each value represents the mean ± SEM of four animals (*Significantly different from control; **significantly different from OTM group). (D) Representative axial μCT sections showing decrease in bone density in OTM+ HFA at 14 days. Arrow demonstrates the direction of force application. (E) Average bone volume fraction (bone volume/total volume [BV/TV]) was calculated for Control, OTM and OTM+HFA group for the alveolar bone in the area of the maxillary first molar. Each value represents the mean ± SEM of four animals. (* Significantly different from control; ** significantly different from OTM group).

