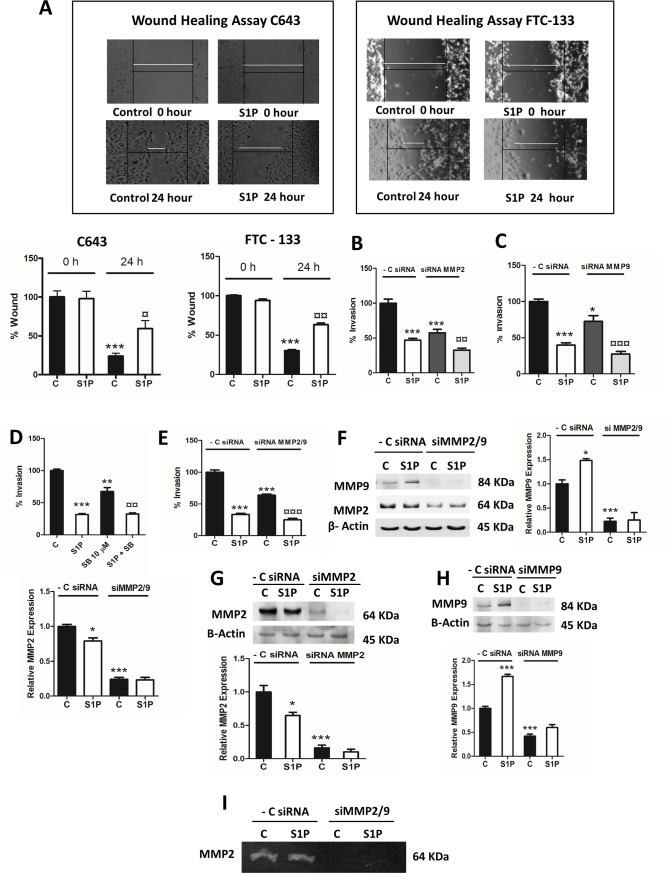
Fig 5. MMP2 and MMP9 regulate C643 invasion.
(A) Wound healing assay for C643 and FTC-133 cell migration. Images were taken immediately after wound scratch at 0 h and after 24 h. The cells were stimulated with vehicle or 100 nM S1P. The images are representative of three separate experiments. The data are presented as % wound in respective graphs. (B and C) C643 cells were transfected with negative control siRNA, MMP2 siRNA or with MMP9 siRNA. After 48 hours of transfection, the cells were allowed to invade through collagen IV towards 5% lipid-stripped FBS for 6 h. (D) C643 cells were pre-incubated with the MMP2/9 inhibitor SB (10 μM, 1 h) and were allowed to invade towards 5% lipid-stripped FBS for 6 hours in the presence or absence of 100 nM S1P. (E) C643 cells were transfected with negative control siRNA or with siRNA for MMP2 and -9. After 48 hours of transfection, the cells were allowed to invade towards 5% lipid-stripped FBS for 6 hours in the presence or absence of 100 nM S1P. (F) C643 cells were transfected with negative control siRNA or with siRNA for MMP2 and -9. After 48 hours of transfection, the cells were stimulated with S1P for 6 hours and the expression of MMP2 and -9 was measured. A representative western blot is shown. β-Actin was used as loading control, and the normalized results are presented in the graphs. (I) As in (F), but the medium was collected and the activity of MMP2 measured using the zymography assay. The data were normalized to the protein content on the plates. (G and H) C643 cells were transfected with negative control siRNA, with MMP2 siRNA or MMP9 siRNA. After 48 hours of transfection, the cells were stimulated with 100 nM S1P for 6 hours and the expression of MMP2 and -9 was measured. Representative western blots are shown. β-Actin was used as loading control, and the normalized results are presented in the graphs. The normalized results in the graphs are the mean ±S.E.M, n = 3. Asterisks (*) denote the statistically significant differences compared with respective control. (¤) indicates comparisons between S1P effects. Data were analyzed with one-way ANOVA and Bonferroni’s post hoc test (* P < 0.05; ** P < 0.01; *** P <0.001; ¤ P < 0.05; ¤¤ P < 0.01; ¤¤¤ P <0.001).

