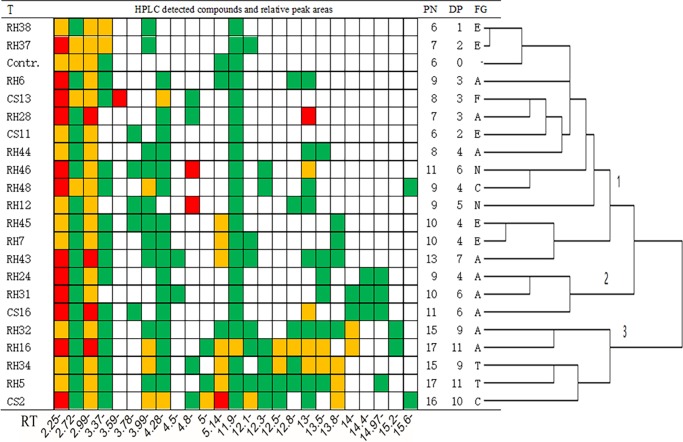
Fig 3. HPLC detected metabolomes and metabolites contents in grape cells, as well as the clustering to all treatments.
T: treatment (represent as endophytic fungal strain ID and the control (Contr)). HPLC detected compounds are marked as colored bricks, and different color represent the relative content (peak area) of the metabolites: 10 mAU*S ≤green <100 mAU*S; 100 ≤yellow < 500 mAU*S; red ≥ 500mAU*S. PN: peak numbers; DP: novel peak numbers when compared to the control; FG: genus of the EFS, E: Epicoccum; A: Alternaria; F: Fusarium; N: Niqrospora; C: Colletotrichum; T: Trichothecium. At the bottom of the figure displayed the retention time (RT) at which the metabolites appeared in this HPLC assay.

