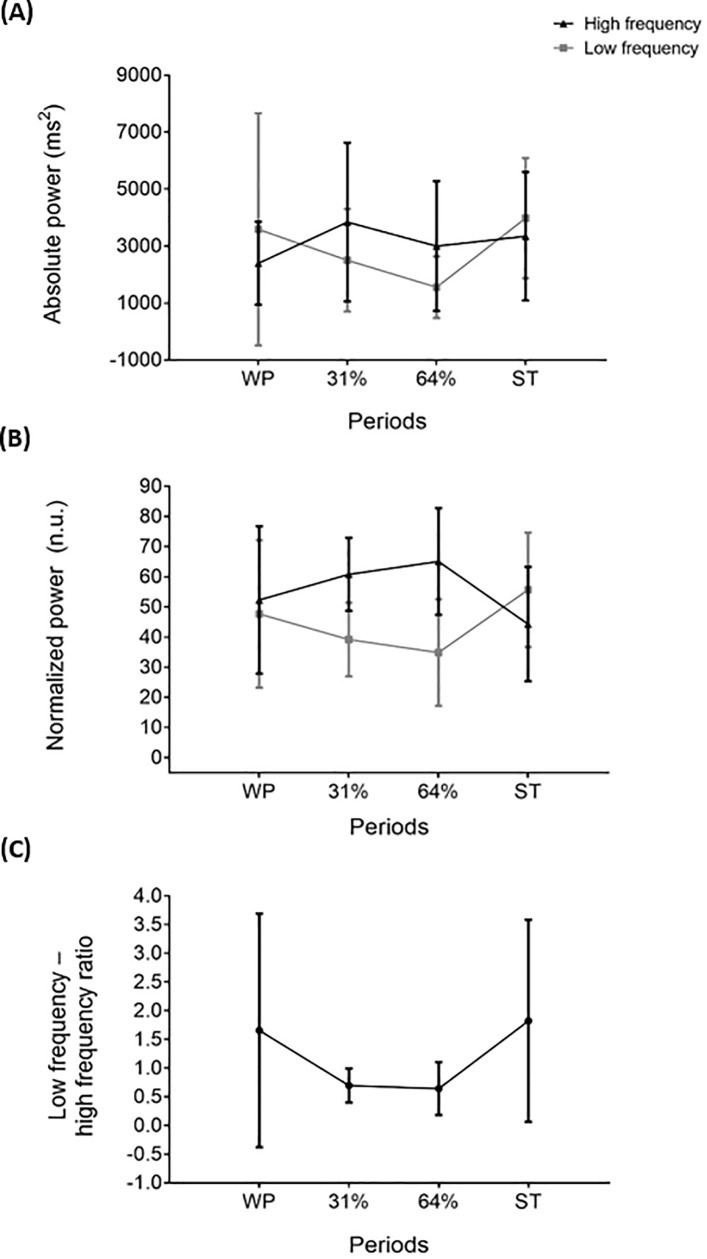
Fig 8. Frequency domain parameters of heart rate variability across study periods.
Panel (A): absolute power, Panel (B): normalized power, Panel (C): low frequency—high frequency ratio. Values are mean ± standard deviation (n = 7). Repeated measures analysis of variance was performed, using Bonferroni post-hoc tests for pairwise comparisons. No significant differences were found across study periods (P>0.05). ST: shivering threshold, WP: warm period, 31% and 64%: percentage of the individual’s time exposed to cold until shivering occurred.

